Ethereum started a downward correction and traded below $ 1,600 against the US dollar. ETH price found support near USD 1,487 and is currently rebounding from losses.
- Ethereum started a downward correction below the USD 1,650 and USD 1,600 levels.
- The price is now trading below $ 1,650 and the 100 hour simple moving average.
- An important bearish trendline is forming on the hourly chart of ETH / USD (data feed via Kraken) with resistance near USD 1,660.
- The pair is likely to move higher again once it hits the $ 1,650 and $ 1,660 resistance levels in the short term.
The price for the Ethereum remains good
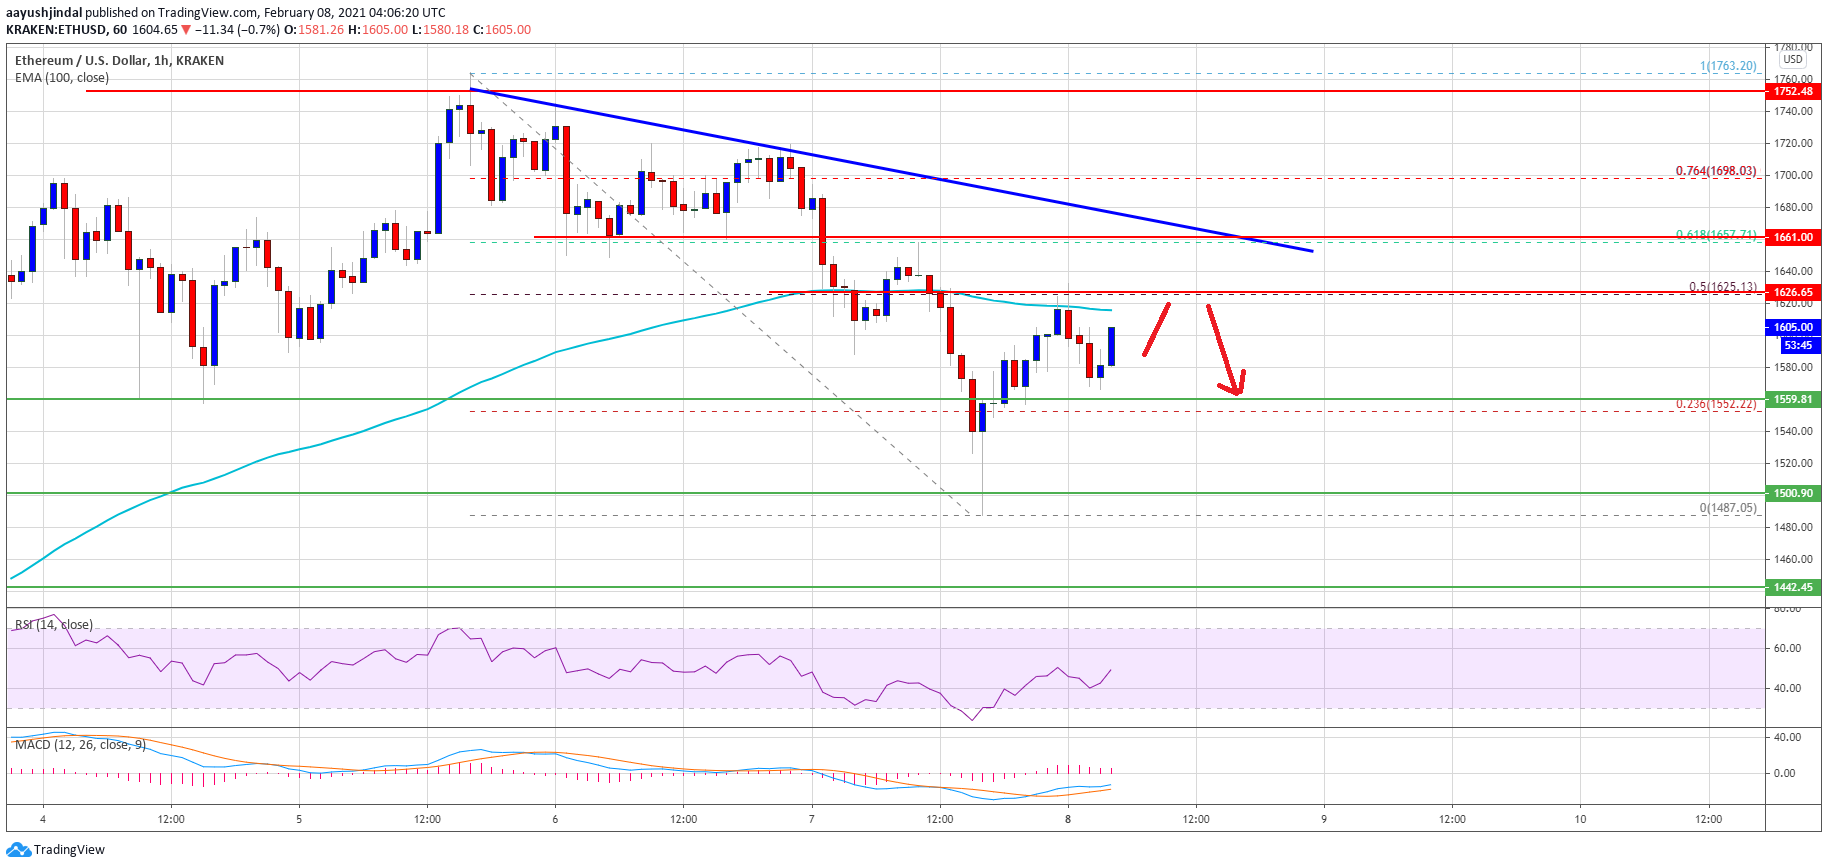
After reaching a new all-time high near $ 1,760, Ethereum began a short-term downward correction. ETH traded below the USD 1,650 and USD 1,600 support levels. There was also a break below the $ 1,560 support level and the 100 hour simple moving average.
Ether tested the $ 1,500 support zone and a low was formed near $ 1,487. The price is currently moving higher and trading above the $ 1,550 level. There was a break above the 23.6% Fib retracement level of the downward move from the high of $ 1,763 to the low of $ 1,487.
The price is now facing resistance near the $ 1,620 level and a simple 100 hour moving average. The 50% Fib retracement level of the move down from the high of $ 1,763 to the low of $ 1,487 is also at $ 1,625.
Source: ETHUSD on TradingView.com
The next major resistance is near the $ 1,650 level. An important bearish trendline is also forming on the hourly chart of ETH / USD with resistance near USD 1,660. A sharp break above the trendline resistance and $ 1,665 could open the doors for a steady rise. In the aforementioned case, the price should hit the high of $ 1,760 again in the near future.
Dips supported at ETH?
If Ethereum fails to hit the $ 1,620 and $ 1,650 resistance levels, it could see another decline. On the downside, initial support is near the $ 1,560 and $ 1,550 levels.
A downside break below the USD 1,550 support zone could trigger strong bearish moves. The next major support is near the $ 1,500 level below which the price could drop towards the $ 1,450 (a multi-touch zone) support.
Technical indicators
Hourly MACD – – The MACD for ETH / USD is slowly gaining momentum in the bullish zone.
Hourly RSI – – The RSI for ETH / USD is currently just above the 50 level.
Main support tier – $ 1,550
Main Resistance Level – $ 1,650
