Ethereum saw a sharp rise above the $ 1,650 and $ 1,700 resistance levels against the US dollar. The ETH price is likely to continue to rise towards USD 1,800 in the short term.
- Ethereum started a new surge above the USD 1,650 and USD 1,700 resistance levels.
- The price is now trading well above $ 1,700 and the 100-hour simple moving average.
- A major bullish trendline is forming on the hourly chart of ETH / USD (data feed via Kraken) with support near USD 1,660.
- The pair could correct lower but the bulls are likely to remain active near $ 1,700 and $ 1,680.
The price for the Ethereum wins bullishly
Ethereum formed a strong support base above $ 1,600 before rising above $ 1,650. ETH also formed a base above the $ 1,650 level before the bulls pushed the price above the $ 1,700 resistance level.
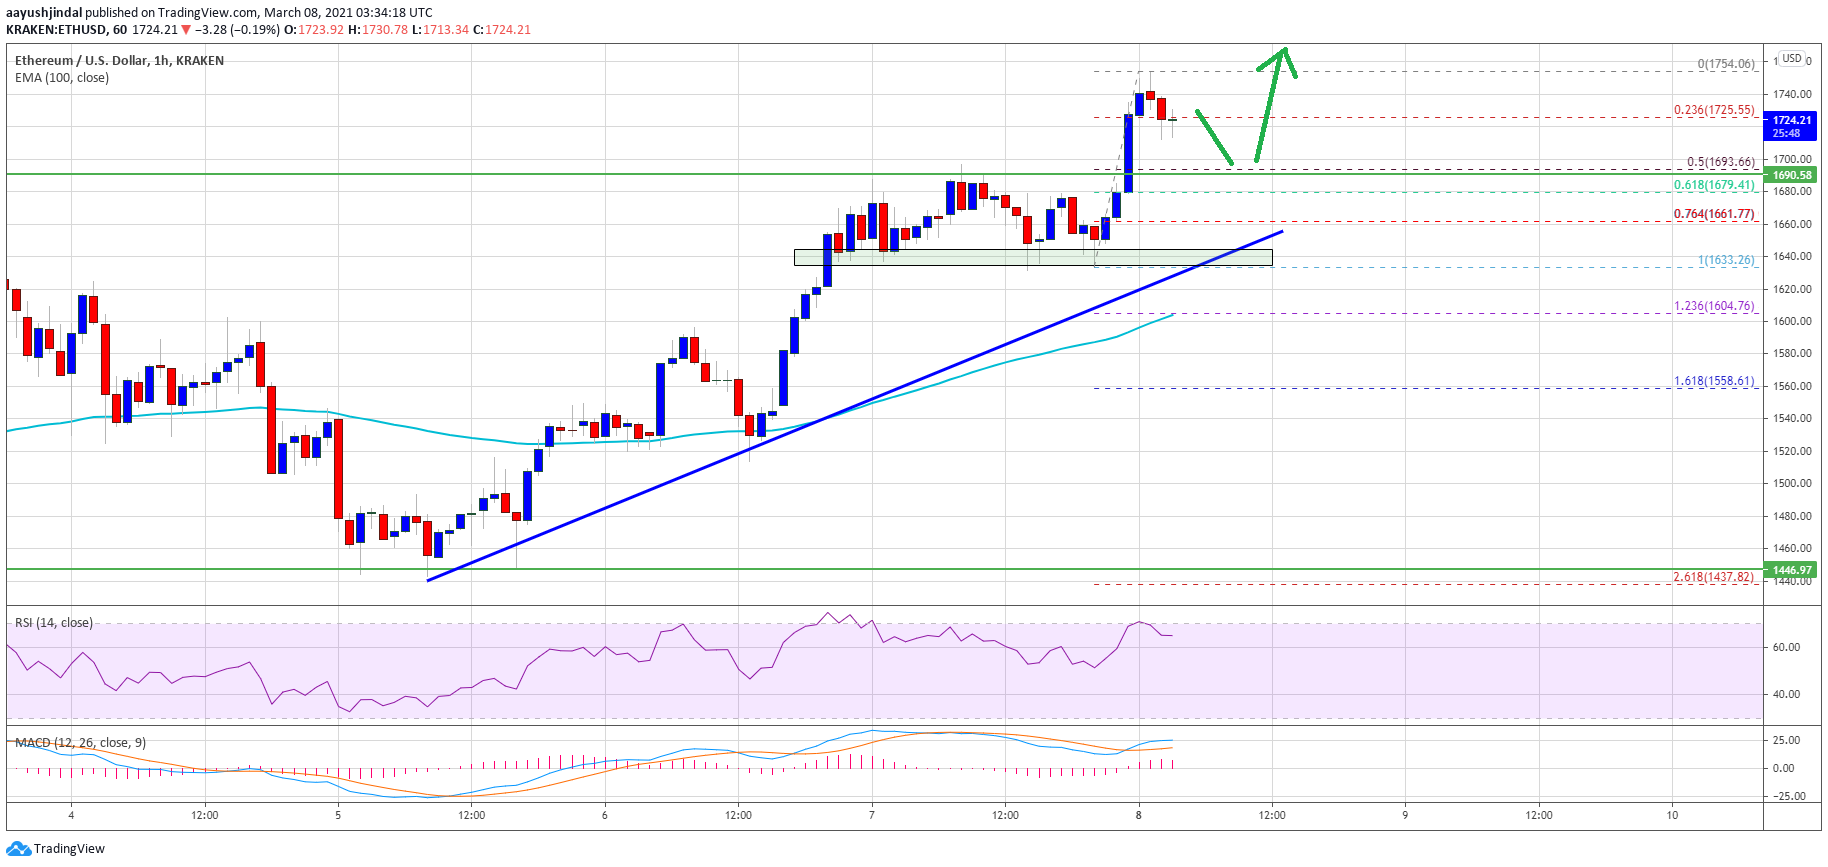
It gained over 5% to hit a new weekly high at USD 1,754. It is currently trading well above $ 1,700 and the 100 hour simple moving average. Initial support on the downside is near the $ 1,700 level. The 50% Fib retracement level of the move up from the low of $ 1,633 to the high of $ 1,754 is also near $ 1,695.
Source: ETHUSD on TradingView.com
Additionally, a major bullish trendline is forming with support near USD 1,660 on the ETH / USD hourly chart. The trendline is close to the 76.4% fib retracement level of the move up from the low of $ 1,633 to the high of $ 1,754.
On the upside, the $ 1,750 level is a crucial resistance to further gains. A sharp break above the recent high could open the doors for a move towards the $ 1,800 level. The next major resistance is near the $ 1,850 level.
Dips supported at ETH?
If Ethereum doesn’t stay higher than the $ 1,740 and $ 1,750 resistance levels, a downside correction could be initiated. Initial support on the downside is near the $ 1,700 level.
The main support is now forming near the trendline and USD 1,650. If a downside break occurs below trendline support, there is a risk of further losses. In that case, the ether price could potentially fall towards the USD 1,620 support zone in the short term.
Technical indicators
Hourly MACD – – The MACD for ETH / USD shows positive signs in the bullish zone.
Hourly RSI – – The RSI for ETH / USD is now well above the 50 level.
Main support tier – $ 1,650
Main Resistance Level – $ 1,750
