The price of Binance coins is up over 35% and the rally above $ 200 against the USDT has been extended. The NBB was trading at a record high of $ 238 and it appears that there are chances of further upward movement.
- Binance coin price extended its rally above the $ 175 and $ 200 resistance levels against the USDT.
- The price hit a new all-time high of $ 238, well above the simple moving average of 100 (4 hours).
- On the 4-hour chart of the BNB / USDT pair (data source from Binance) there was a break above some bullish continuation patterns at USD 170 and USD 200.
- There are consolidating gains and are likely to continue rising towards $ 250 and $ 275.
Binance Coin Price Rallies 35%
In the past few days, the Binance coin has seen strong upward momentum above the $ 100 level. The BNB price outperformed Bitcoin and Ethereum with massive gains.
It even broke the $ 150 and $ 175 resistance levels. During the recent rally, the BNB / USDT pair’s 4-hour chart broke above some bullish continuation patterns at $ 170 and $ 200. The pair even surged above the $ 200 and $ 210 levels.
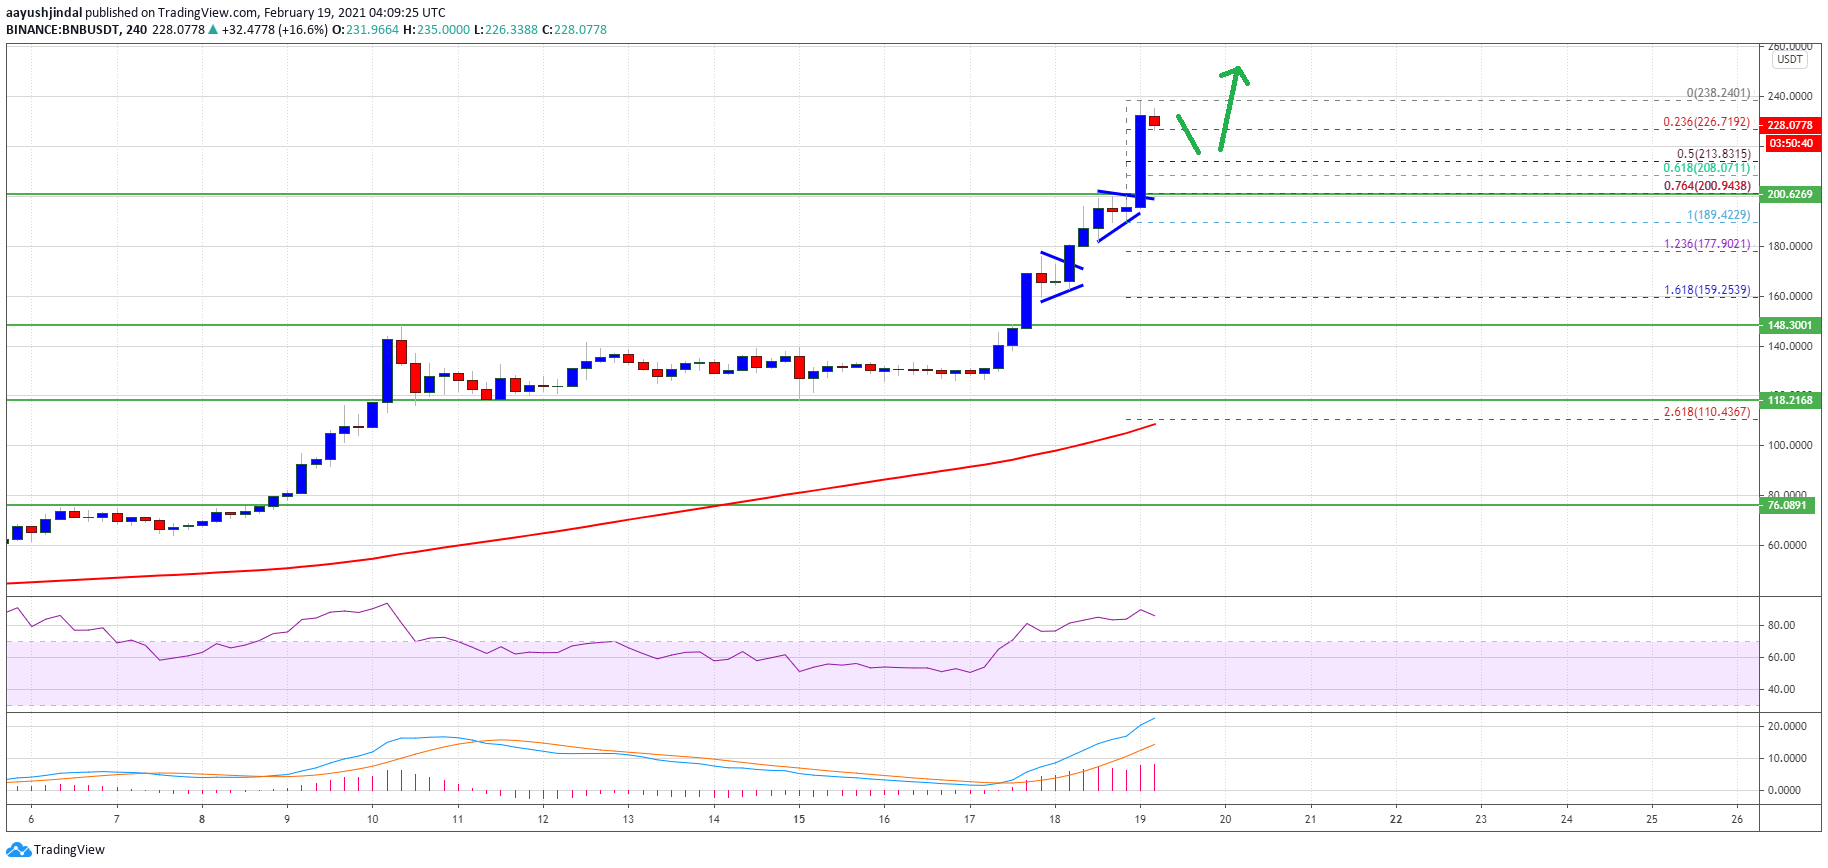
It traded at a new all-time high of $ 238, well above the simple moving average of 100 (4 hours). The NBB is currently correcting gains and testing the $ 225 level.
Source: BNBUSDT on TradingView.com
The 23.6% fib retracement level of the recent rally from the low of $ 189 to the high of $ 238 is strong support. If there are further losses, the price could fall towards $ 210.
On the upside, the USD 240 level is a short-term hurdle. The next major resistance is near the $ 250 level. A significant break above the $ 250 level will most likely open the doors for a sharp move towards the $ 285 and $ 300 levels in the near future.
Dips supported in BNB?
If the BNB stops rising above $ 240 and $ 250, a downside correction could occur. The first major support is near the USD 225 level.
The next big support is near the $ 210 level. It is close to the 50% Fib retracement level of the recent rally from the low of $ 189 to the high of $ 238. Further losses could require a $ 200 test.
Technical indicators
4 Hour MACD – The MACD for BNB / USDT is gaining momentum in the bullish zone.
4-Hour RSI (Relative Strength Index) – The RSI for BNB / USDT is currently in the overbought zone.
Major support levels – $ 225, $ 210, and $ 200.
Main Resistance Levels – $ 240, $ 250, and $ 300.
