Bitcoin price started a downward correction from the all-time high of $ 52,750 against the US dollar. BTC is now approaching some key supports near $ 50,500.
- Bitcoin hit near the $ 52,750 level and started a downward correction.
- The price is still well over $ 50,000 and the 100 hour simple moving average.
- A major bullish trendline is forming on the hourly chart of the BTC / USD pair (data feed from Kraken) with support close to $ 50,400.
- The pair is likely to bounce back from $ 50,400 or $ 50,000 in the upcoming sessions.
Bitcoin price corrects profits
After Bitcoin price hit a new all-time high near $ 52,750, a downward correction began. BTC has surpassed the $ 52,000 support level to enter a short-term bearish zone.
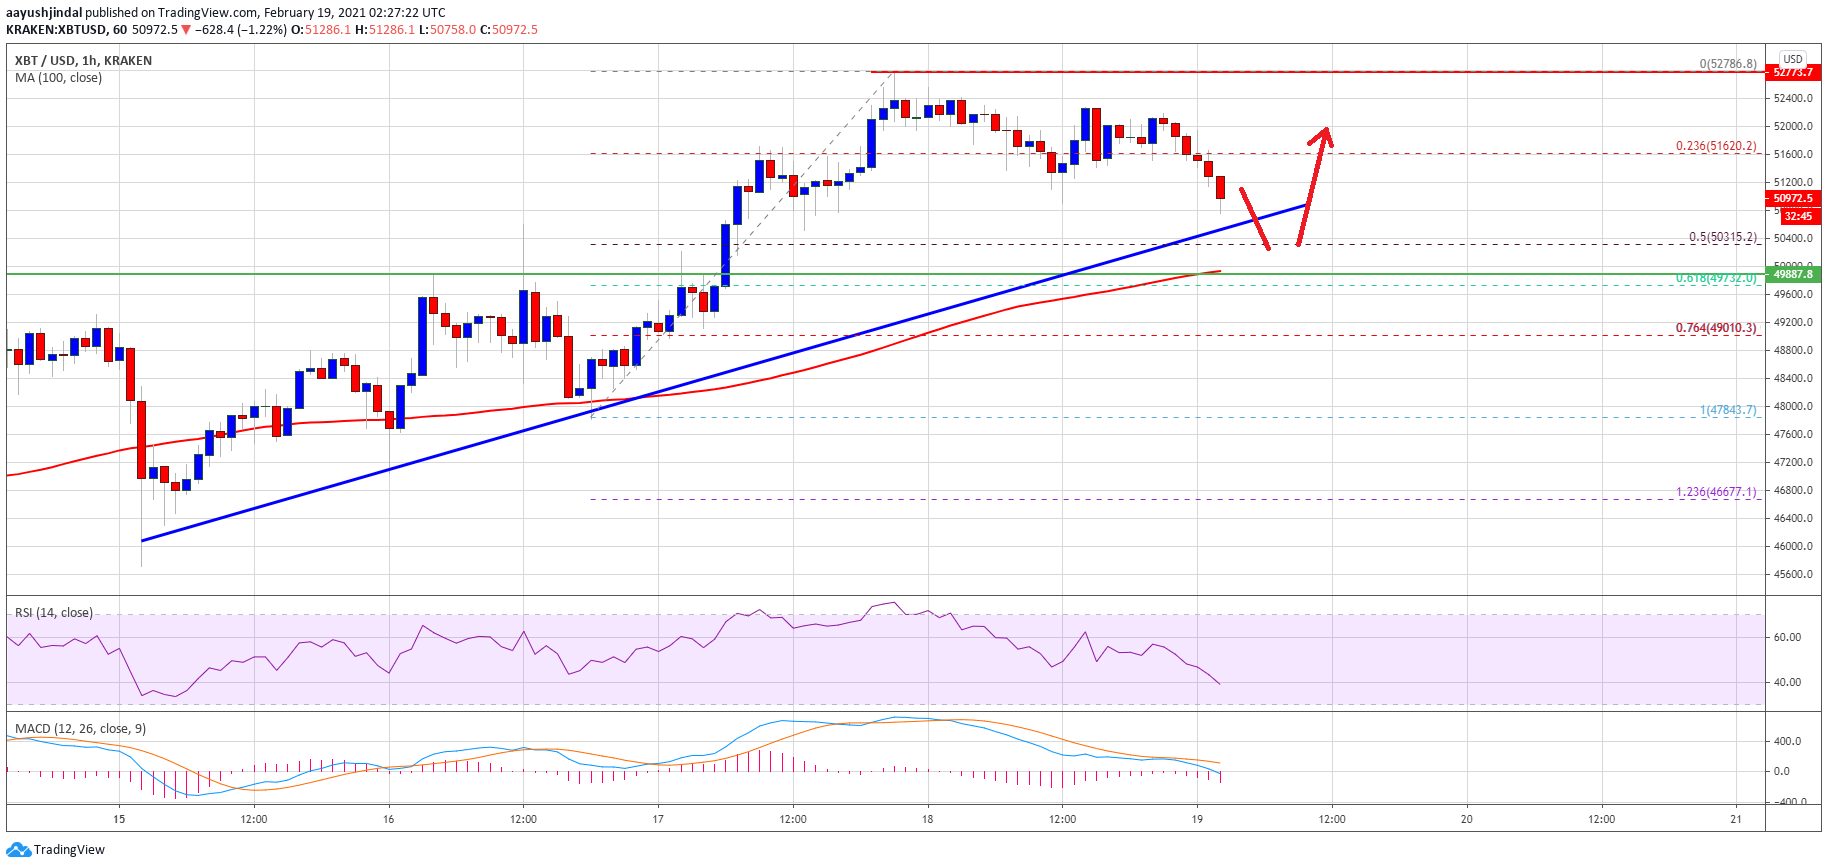
There was a break below the 23.6% Fib retracement level of the move up from the $ 47,843 low to the $ 52,750 high. It is now approaching some key supports near the $ 50,500 level.
More importantly, Bitcoin is still well above $ 50,000 and the 100 hour simple moving average. A major bullish trendline is also forming on the hourly chart of the BTC / USD pair with support close to $ 50,400. The next big support is near the $ 50,320 level.
Source: BTCUSD on TradingView.com
The 50% Fib retracement level of the move up from $ 47,843 low to $ 52,750 high is near the $ 50,320 level to provide support. The main support is at $ 50,000 and the 100 hour simple moving average. Further losses could potentially result in a steady decline towards the USD 48,000 support zone. Further losses could require a test of the key support level of $ 45,000.
New rise in BTC?
If Bitcoin stays stable above the USD 50,500 and USD 50,000 support levels, it could cause another spike. Initial resistance to the upside is near the $ 51,500 level.
The first major resistance is near the $ 52,000 level, above which the price is likely to accelerate towards the $ 52,750 high. If the price rises above $ 52,500 and $ 52,750, there is a high possibility in the upcoming sessions that the uptrend will be above the $ 53,500 level.
Technical indicators:
Hourly MACD – The MACD is slowly gaining momentum in the bearish zone.
Hourly RSI (Relative Strength Index) – The RSI for BTC / USD is now well below the 50 level.
Major support levels – $ 50,500 followed by $ 50,000.
Main Resistance Levels – $ 51,500, $ 52,000, and $ 52,750.
