Bitcoin price gained bullish momentum above the $ 57,000 resistance against the US dollar. BTC is trading well over $ 58,000 now and is likely to continue to rise.
- Bitcoin is up over 5% and has passed the key resistance level of $ 58,000.
- The price is now well above the $ 58,000 resistance and 100 hour simple moving average.
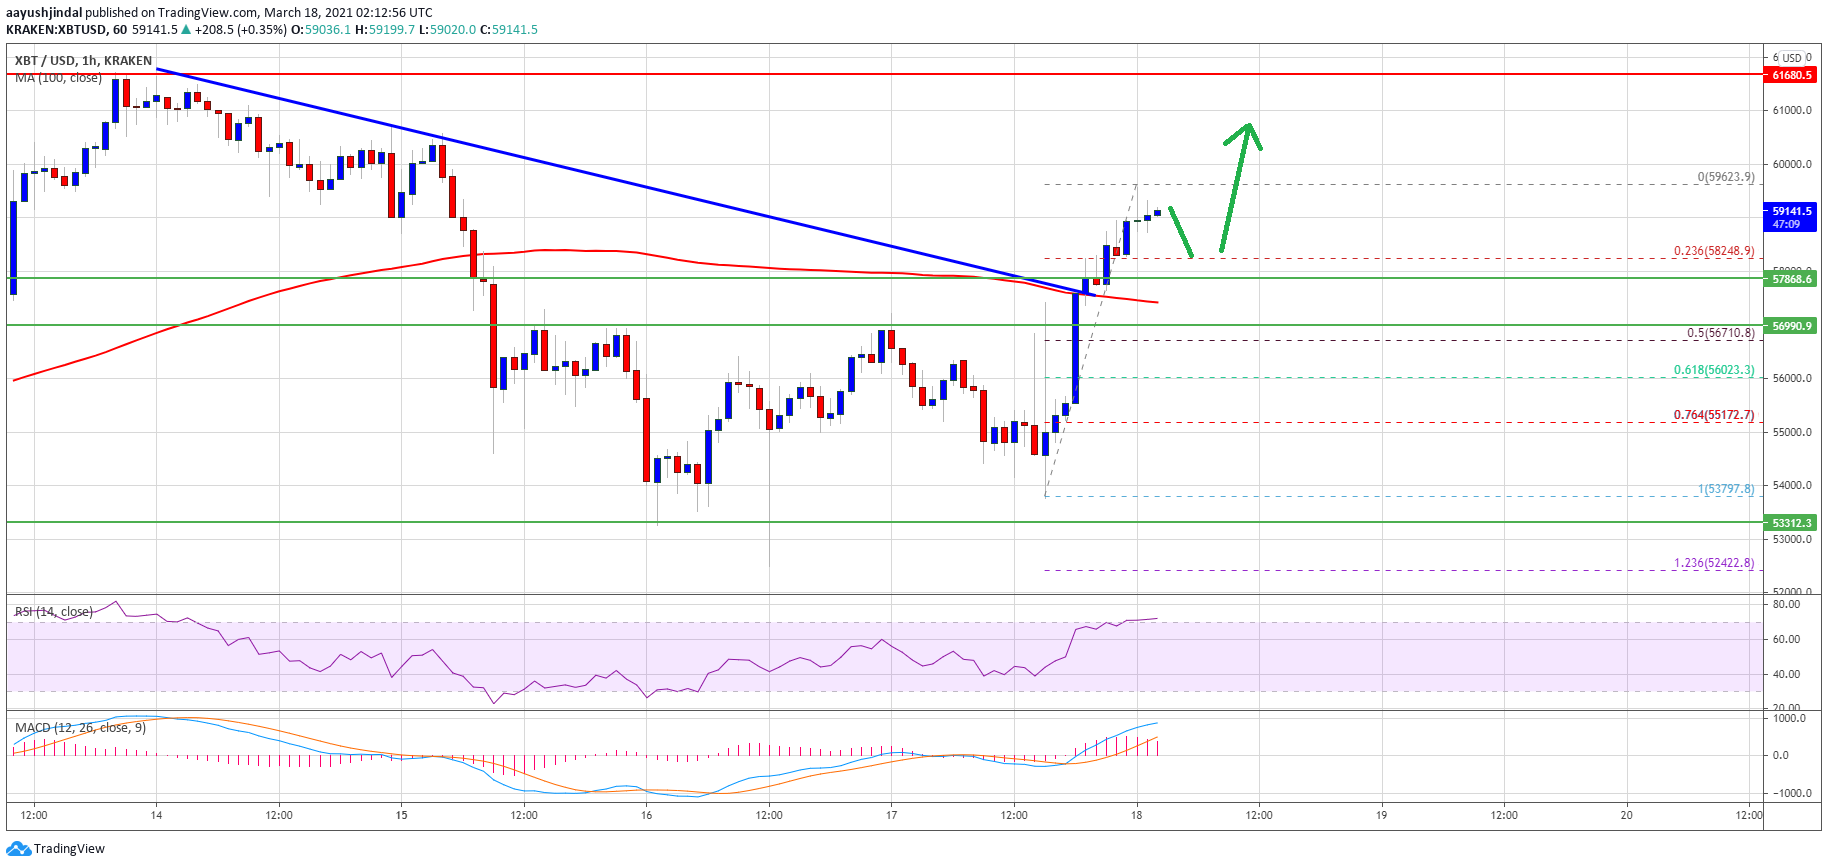
- On the hourly chart of the BTC / USD pair (data feed from Kraken) there was a break above a large bearish trendline with resistance near USD 57,500.
- The pair is likely to continue rising towards the $ 60,000 and $ 60,500 levels in the near future.
Bitcoin price is gaining momentum
After Bitcoin formed a base above $ 55,000, a new surge began. BTC has cleared many hurdles near USD 57,000 and USD 58,000 (as discussed yesterday) to get into a positive zone.
The hourly chart for the BTC / USD pair broke above a large bearish trendline with resistance near USD 57,500. The pair even broke the 61.8% fib retracement level of the key drop from $ 61,695 to $ 53,220.
It opened the doors to further gains and the price even surged over $ 59,000. A high is being formed near $ 59,623 and the price is now well above the $ 58,000 resistance and 100-hour simple moving average.
Source: BTCUSD on TradingView.com
Initial support is near the USD 58,250 level. It is close to the 23.6% fib retracement level of the recent spike from $ 53,797 to $ 59,623. On the upside, the price is encountering resistance near the USD 59,500 level. The next major resistance is near the $ 60,000 level. A clear closing price above the $ 60,000 level could open the doors for a larger move to $ 61,500 in the short term.
Fresh dip in BTC?
If Bitcoin isn’t above the $ 60,000 resistance, it could see another drop. The first major support on the downside is near the $ 57,500 level.
The main support is now forming near the $ 57,000 level and the 100 hour simple moving average. Further losses could require a test of the $ 55,000 support zone in the upcoming sessions.
Technical indicators:
Hourly MACD – The MACD is now gaining momentum in the bullish zone.
Hourly RSI (Relative Strength Index) – The RSI for BTC / USD is now well above the 50 level.
Major Support Levels – $ 57,500, followed by $ 57,000.
Main Resistance Levels – $ 59,500, $ 60,000, and $ 61,500.
