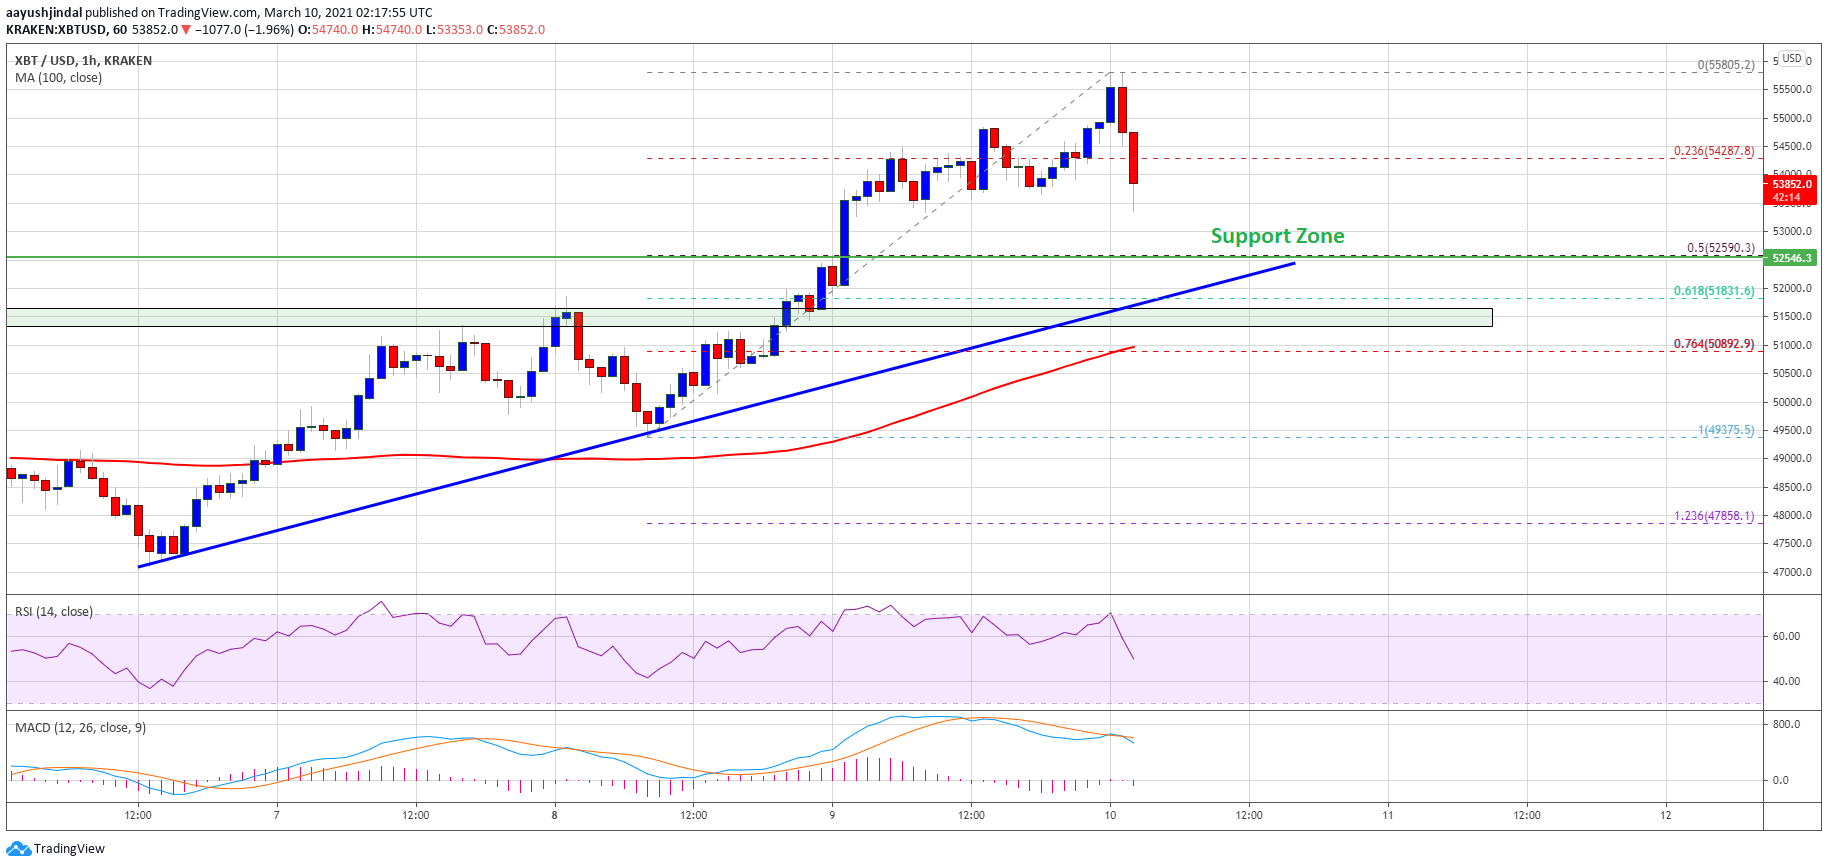
Bitcoin price has extended its surge above the $ 55,000 resistance against the US dollar. BTC corrects lower from $ 55,800 and could find bids near the $ 52,500 zone.
- Bitcoin continued to climb above the $ 54,500 and $ 55,000 resistance levels.
- The price is now trading well above $ 52,500 and the 100-hour simple moving average.
- A major bullish trendline is forming on the hourly chart of the BTC / USD pair (data feed from Kraken) with support near USD 52,500.
- The pair is currently correcting gains but is likely to find support near $ 52,500 and $ 52,000.
Bitcoin price remains high
Bitcoin has seen an upward extension above the USD 54,500 resistance zone. BTC even broke the USD 55,000 resistance and was well above the 100-hour simple moving average.
It tested the $ 55,800 resistance zone before the bears surfaced. A high is being formed near $ 55,805 and the price is currently correcting lower. It traded below the 23.6% Fib retracement level of the recent surge from the $ 49,375 low to the $ 55,805 high.
Bitcoin is testing the $ 53,500 support level and it is still well above the 100-hour simple moving average. The next big support is near the $ 52,500 level. A major bullish trendline is also forming on the hourly chart for the BTC / USD pair with support near USD 52,500.
Source: BTCUSD on TradingView.com
The trendline is close to the 50% fib retracement level of the recent spike from $ 49,375 to $ 55,805. On the upside, the USD 55,000 level is likely to act as resistance again. The next major resistance is near the $ 55,500 level. A sharp break above the $ 55,500 resistance could open the doors for a move above the $ 56,000 level.
Dips supported in BTC?
If Bitcoin continues to decline, the $ 52,800 and $ 52,500 levels will likely hold losses. If there is a downside break below trendline support, there is a possibility of a move towards USD 52,000.
The next big support is near the $ 51,200 level. Other drawbacks could require a test of the $ 50,000 main support zone in the upcoming sessions.
Technical indicators:
Hourly MACD – The MACD is slowly losing momentum in the bullish zone.
Hourly RSI (Relative Strength Index) – The RSI for BTC / USD is now approaching the 50 level.
Major support levels – $ 53,000 followed by $ 52,500.
Main Resistance Levels – $ 54,500, $ 55,000, and $ 55,500.
