Bitcoin price began a downward correction below $ 46,000 against the US dollar. BTC is now consolidating over the $ 43,800 support and 100 hour SMA.
- Bitcoin didn’t stay above the $ 47,000 level and corrected below $ 46,000.
- The price holds the $ 44,000 level and the 100 hour simple moving average.
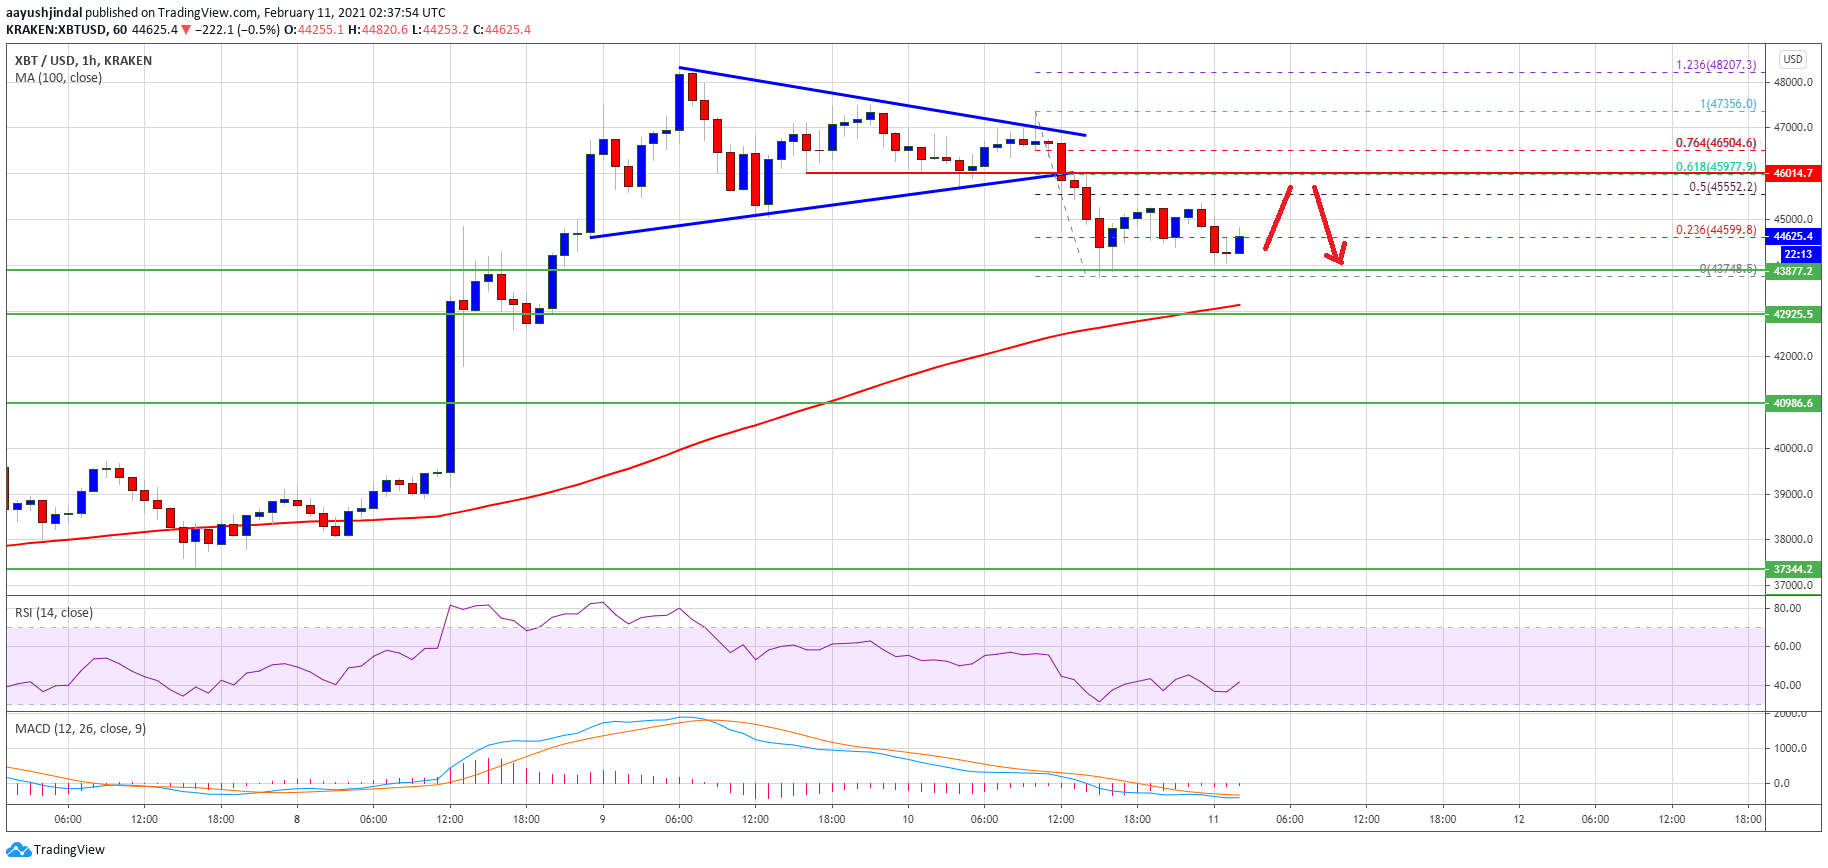
- On the hourly chart of the BTC / USD pair (data feed from Kraken) there was a break under a major triangle pattern with support close to $ 46,000.
- The pair is likely to start a fresh move if it stays above $ 43,000 and the 100-hour SMA.
Bitcoin price is showing some bearish signs
After Bitcoin price struggled to climb back above $ 47,000, it began a downward correction. BTC traded below the USD 46,000 support level to enter a short-term bearish zone.
There was also a break below a major contraction triangle pattern with support near USD 46,000 on the hourly chart of the BTC / USD pair. The pair even traded below the $ 45,000 and $ 44,450 levels. A low is being formed near $ 43,748 and the price is currently consolidating losses.
Initial resistance to the upside is near the $ 45,500 level. It is close to the recent 50% drop in the fib retracement level from $ 47,356 to $ 43,748.
The next major resistance is near the $ 46,000 level (the most recent collapse zone). The recent 61.8% decline in Fib retracement level from the high of $ 47,356 to the low of $ 43,748 is also near the $ 46,000 level. A successful break above the USD 46,000 resistance level should lead to a renewed spike in the short term.
The next major resistance is near the $ 47,000 level. Further gains could open the doors for a push towards $ 48,000.
Dips supported in BTC?
If Bitcoin stops rising, it could correct further below the $ 44,000 level. The first major support is near the $ 43,750 level.
The main support is now forming near the $ 43,000 level or the 100 hour simple moving average. Further losses below $ 43,000 could potentially move the price towards the $ 41,000 support level in the short term.
Technical indicators:
Hourly MACD – The MACD is slowly losing momentum in the bearish zone.
Hourly RSI (Relative Strength Index) – The RSI for BTC / USD is now below the 50 level.
Major Support Levels – $ 43,750, followed by $ 43,000.
Main Resistance Levels – $ 45,500, $ 46,000, and $ 47,000.
