Bitcoin price is showing signs of recovery above $ 32,000 against the US dollar. BTC faces a tough task at $ 34,000 and is likely to continue to decline towards $ 30,000.
- Bitcoin corrects higher from $ 28,865 and trades above the $ 32,000 resistance.
- The price faces strong resistance near USD 34,000 and the 100 simple moving average (4 hours).
- A short-term contraction triangle is forming on the 4-hour chart of the BTC / USD pair (data feed from Kraken) with resistance near USD 33,000.
- The pair could face strong resistance near the $ 33,800 and $ 34,000 levels in the short term.
Bitcoin price remains at risk
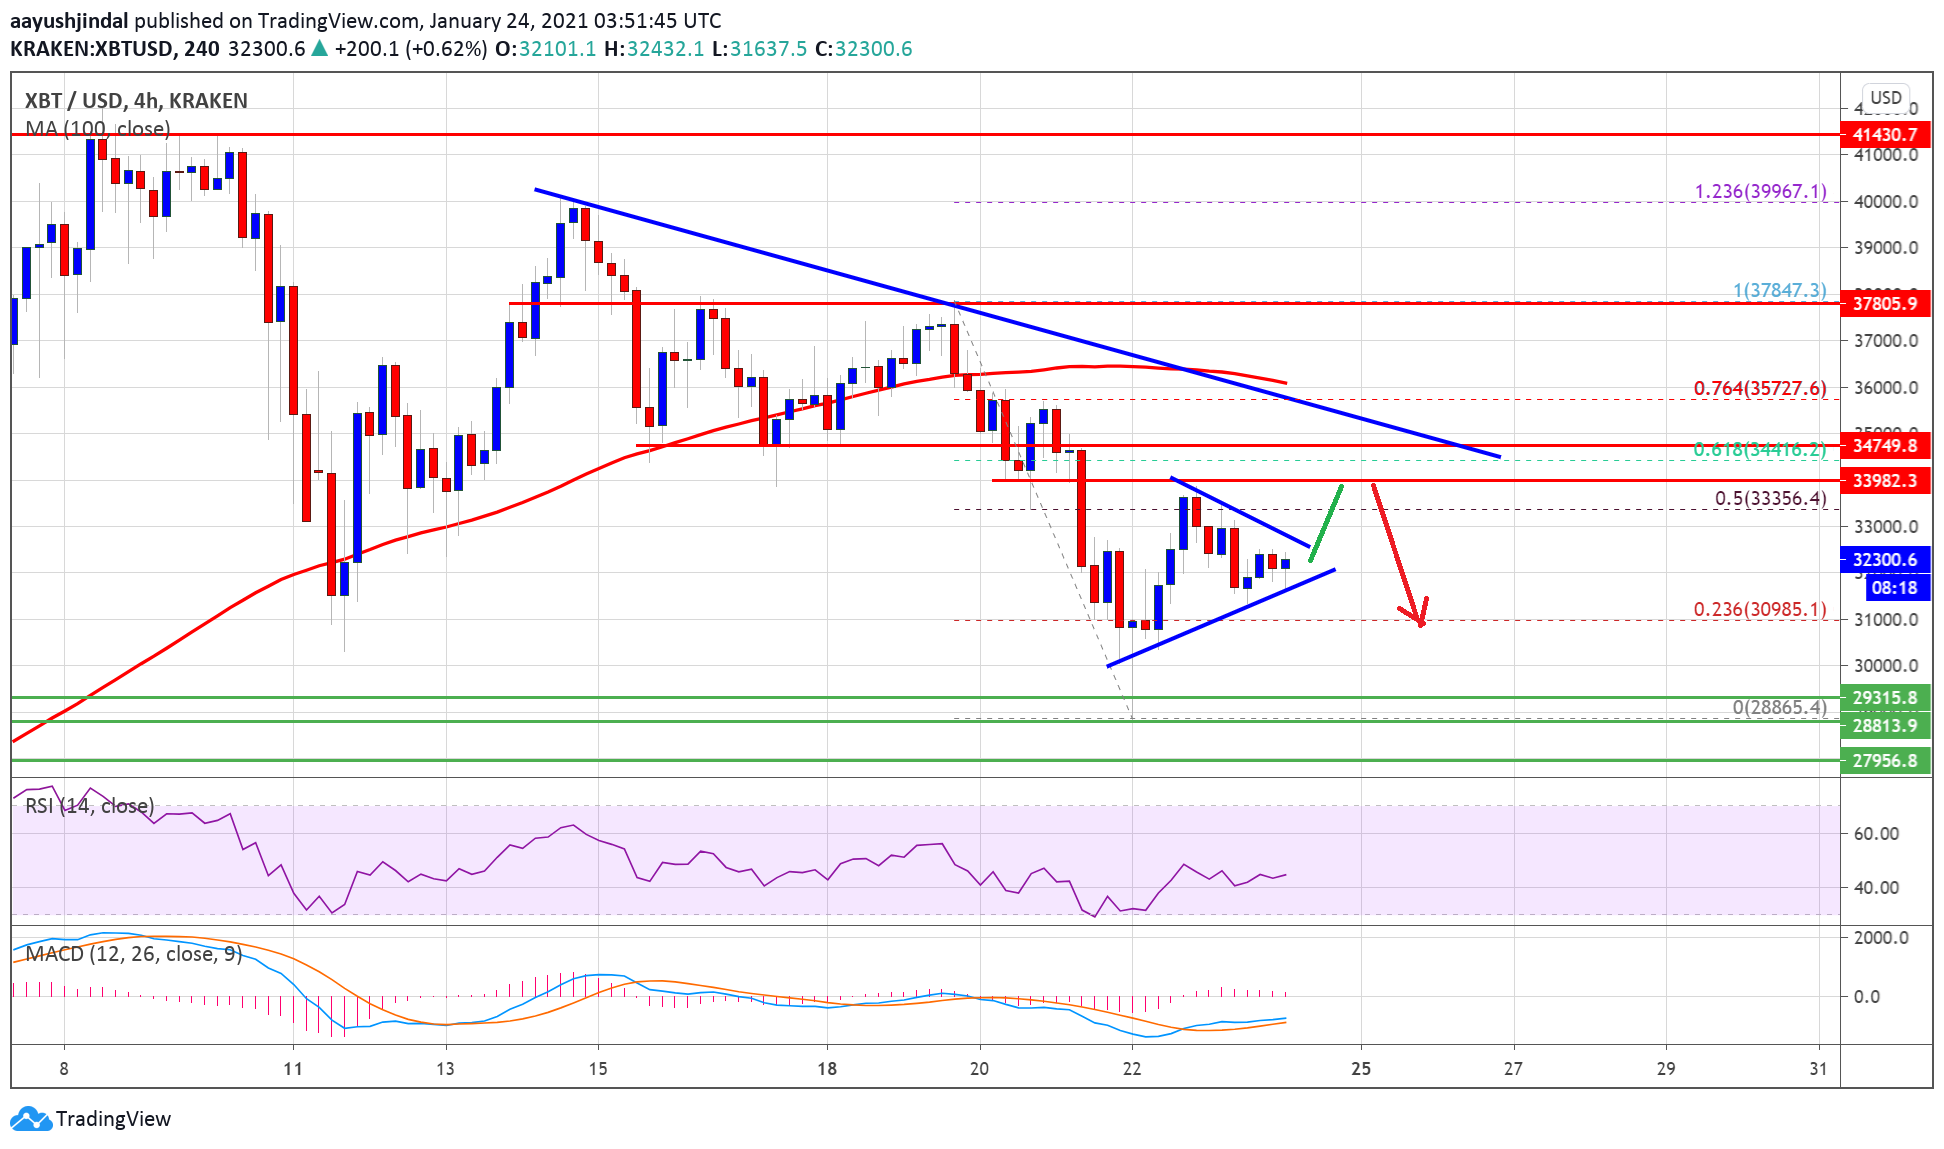
Over the past week, Bitcoin price fell sharply below the support levels of $ 35,000 and $ 34,000 against the US dollar. The BTC / USD pair even fell below the USD 30,000 support and was well below the 100 (4 hours) simple moving average.
A low was formed near $ 28,800 before the price began an upward correction. It has passed the $ 30,000 level and even bounced back above the $ 31,500 level.
There was also a test of the 50% fib retracement level of the downward move from the $ 37,847 swing high to the $ 28,867 low. A short-term contraction triangle is also forming on the 4-hour chart of the BTC / USD pair with resistance near USD 33,000.
Source: BTCUSD on TradingView.com
If the triangle breaks, the price could face hurdles near the $ 33,800 and $ 34,000 levels. There is also a major bearish trendline forming near $ 34,500 on the same chart. It is close to the 61.8% Fib retracement level of the downward move from the $ 37,847 swing high to the $ 28,867 low.
A closing price above the $ 34,000 and $ 34,500 resistance levels could open the doors to a bigger move higher. The next big hurdle is near the $ 38,000 level.
Fresh drop of BTC?
If Bitcoin fails to hit the $ 33,500 and $ 34,000 resistance levels, it risks falling further. Initial downside support is near the USD 31,800 level.
A sharp break below the $ 31,800 and $ 31,500 support levels could pave the way for a short-term push towards the $ 30,000 support zone. Further losses could require a test of $ 28,800.
Technical indicators
4 hours MACD – The MACD for BTC / USD is slowly gaining momentum in the bullish zone.
4 hour RSI (Relative Strength Index) – The RSI for BTC / USD rises to the 50 level.
Main Tier of Support – $ 30,000
Main Resistance Level – $ 34,000
