Bitcoin price rose again after falling towards $ 53,000 against the US dollar. BTC is now forming an inverted head and shoulders with a chance of breaking above USD 58,000.
- Bitcoin is showing positive signs above the USD 55,000 support zone.
- The price is now facing resistance near $ 58,000 and the 100 hour simple moving average.
- A key bearish trendline is forming on the hourly chart of the BTC / USD pair (data feed from Kraken) with resistance near USD 58,000.
- The pair should prepare for an uptrend above the USD 58,000 resistance.
Bitcoin price is recovering
After falling sharply, Bitcoin found support above the USD 53,000 level. BTC traded as low as $ 53,222 and recently started a new spike. It solved the $ 54,200 and $ 55,000 resistance levels.
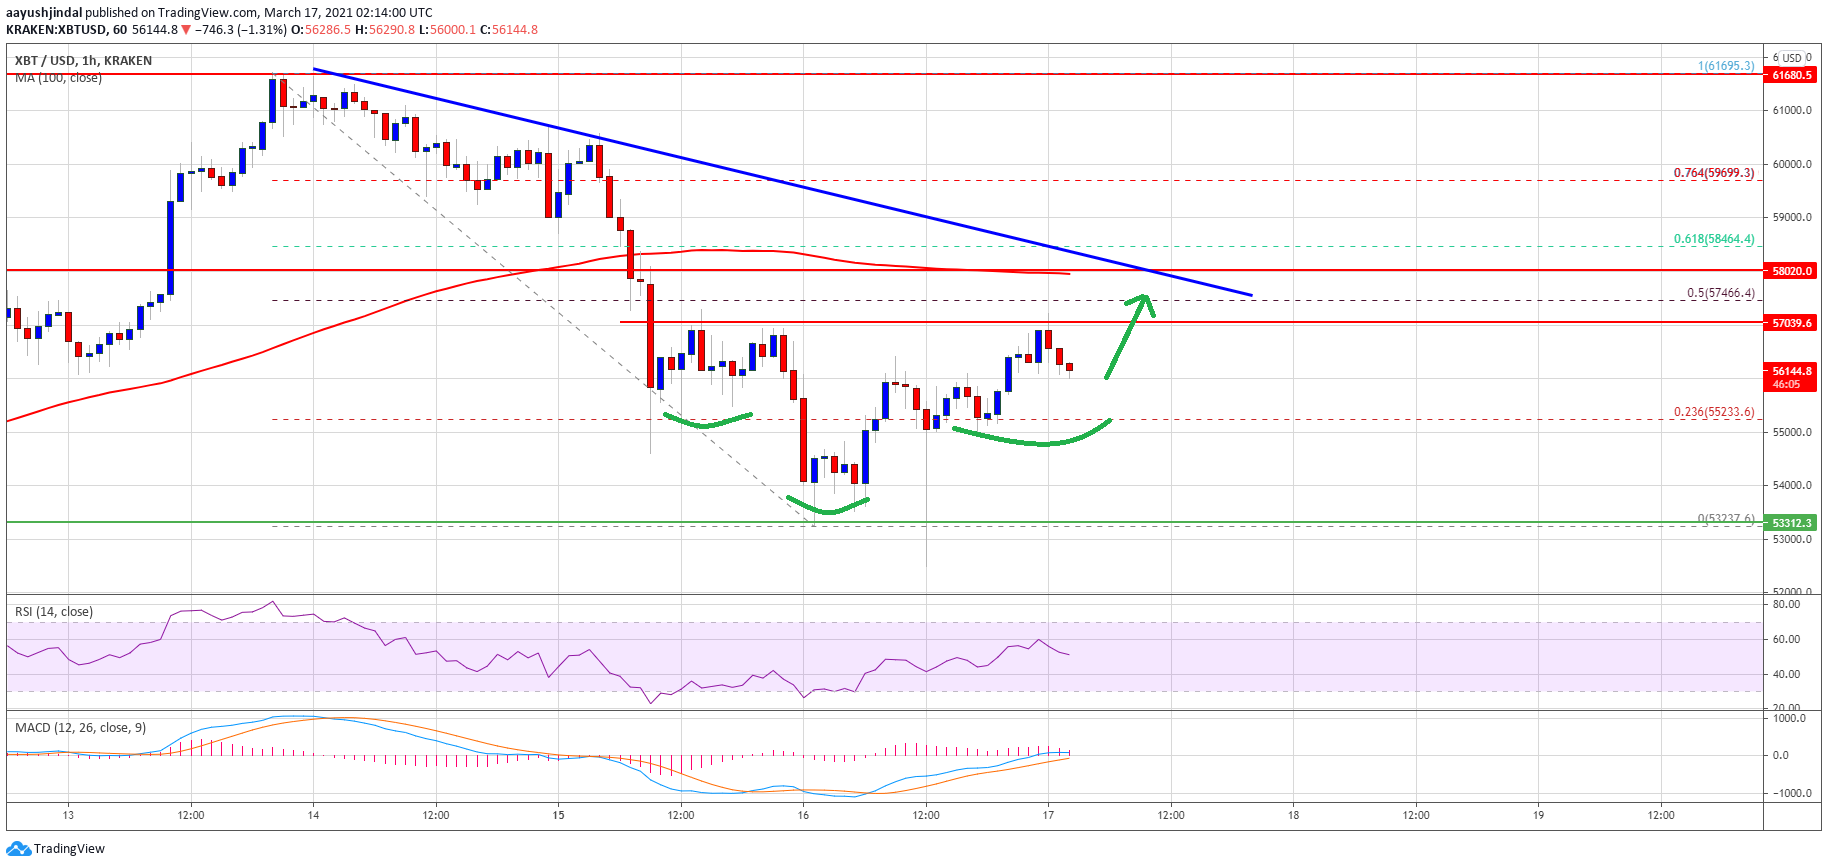
There was a rebound above the 23.6% fib retracement level of the downward move from the high of $ 61,695 to the low of $ 53,220. The price even rose above the $ 56,000 level. However, the price is encountering resistance near $ 58,000 and the 100-hour simple moving average.
It appears that an inverted head and shoulders pattern may be forming with resistance near the $ 57,000 level. An important bearish trendline is also forming on the hourly chart of the BTC / USD pair with resistance near USD 58,000.
Source: BTCUSD on TradingView.com
The trendline is close to the 50% Fib retracement level of the downward move from the high of $ 61,695 to the low of $ 53,220. A successful break above the trendline resistance could open the doors for a decent rise towards the $ 58,800 and $ 60,000 levels.
Fresh bath in BTC?
Unless Bitcoin corrects higher than the $ 57,000 and $ 58,000 resistance levels, it could cause another decline. The first major support on the downside is near the USD 55,000 level.
The next major support is near the $ 54,200 level. If there is a significant break below the $ 54,200 level, the price is likely to continue falling in the coming sessions. The next major support is at $ 53,200, below which the bears could seek a test of the $ 50,000 support level.
Technical indicators:
Hourly MACD – The MACD is slowly gaining momentum in the bullish zone.
Hourly RSI (Relative Strength Index) – The RSI for BTC / USD is struggling to stay above the 50 level.
Major support levels – $ 55,000 followed by $ 54,200.
Main Resistance Levels – $ 57,000, $ 57,500, and $ 58,000.
