Bitcoin price rebounded above $ 48,000 but failed near $ 50,000 against the US dollar. BTC now holds profits above $ 47,000 and will likely make another attempt to exceed $ 50,000.
- Bitcoin is consolidating gains above the USD 47,000 and USD 46,500 support levels.
- The price is now trading well above $ 47,000 and the 100-hour simple moving average.
- A major bearish channel or bullish flag is forming on the hourly chart of the BTC / USD pair (data feed from Kraken) with resistance near USD 49,000.
- The pair could see a sharp rise once it hit $ 49,000 and $ 50,000 in the short term.
Bitcoin price is showing positive signs
After Bitcoin struggled to remove the $ 50,000 resistance, it began a downward correction. BTC fell below the USD 49,500 and USD 49,000 support levels.
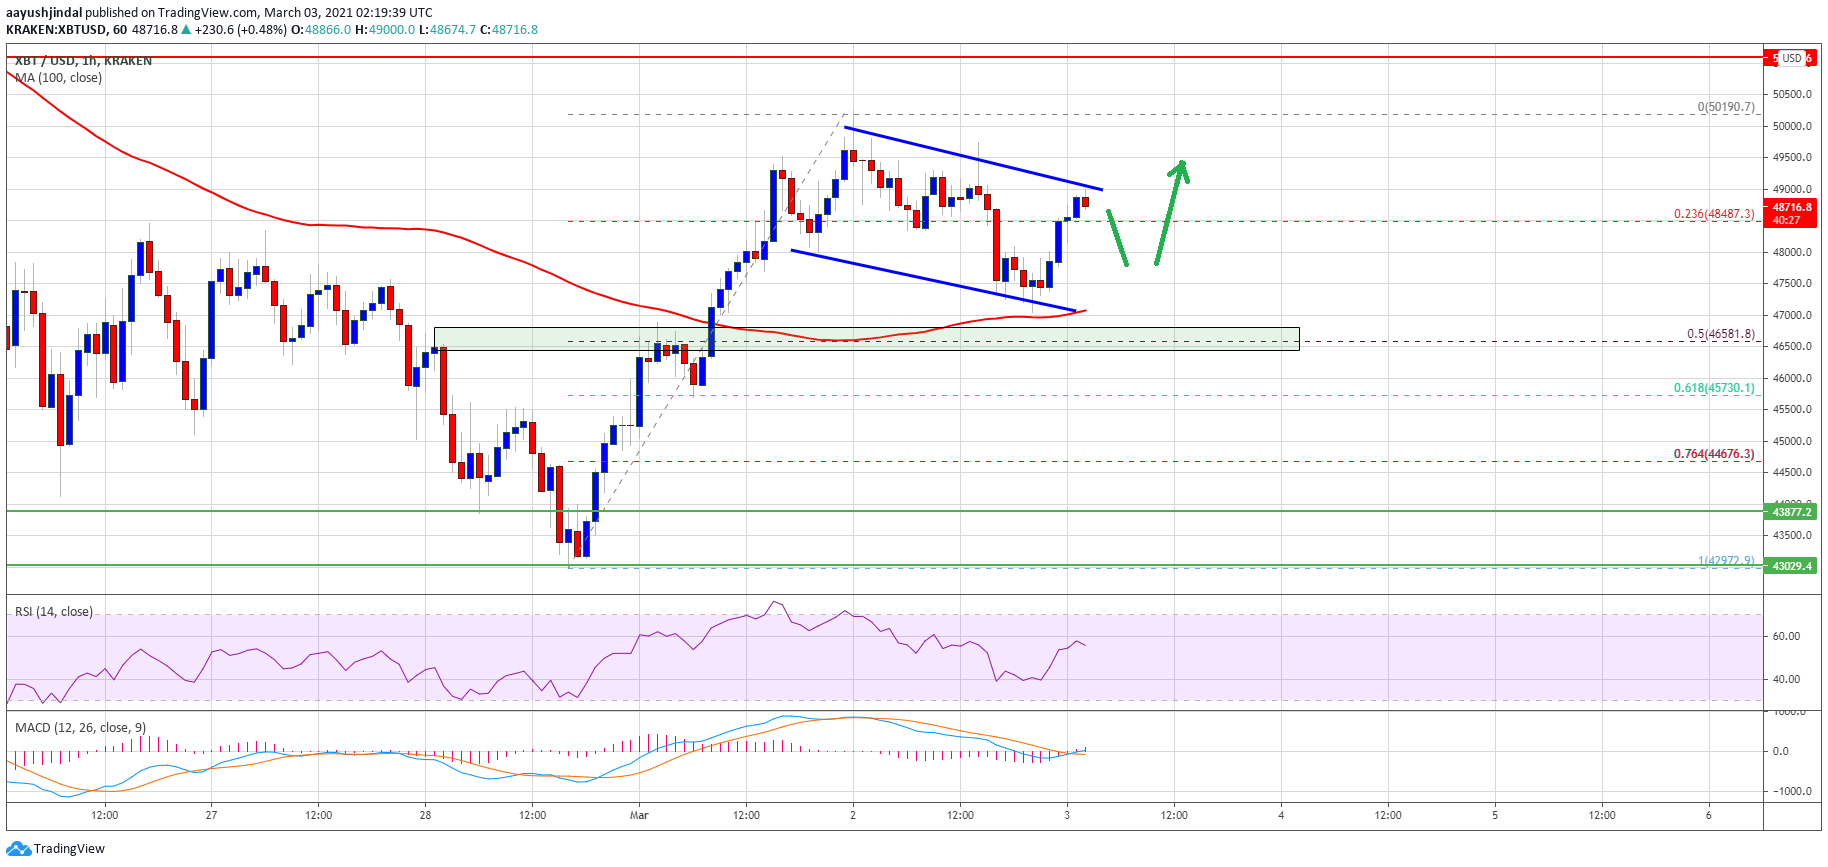
The price even traded below the 23.6% fib retracement level of the uptrend from the $ 43,000 swing low to the $ 50,190 high. It even fell below the $ 48,000 support level. However, the bulls were able to protect the USD 47,000 support zone.
The price remained stable above the 100-hour simple moving average, which is currently $ 47,100. Bitcoin also remained well bid above the 50% fib retracement level of the uptrend from the $ 43,000 swing low to the $ 50,190 high.
Source: BTCUSD on TradingView.com
It appears that a major bearish channel or bullish flag is forming on the hourly chart of the BTC / USD pair with resistance near USD 49,000.
If there is an upward break above the channel resistance, there is a high possibility that the pressure is above the USD 50,000 resistance. The next major resistance is at $ 52,000, above which the bulls are likely to take control.
Fresh dip in BTC?
Unless Bitcoin is above the $ 49,000 and $ 50,000 resistance levels, it could see another decline. The first major support on the downside is near the $ 47,500 level.
The next big support is near the $ 47,000 level and the 100-hour simple moving average. The main breakdown zone is now forming near the $ 46,500 level below which the price could drop to $ 43,000 in the short term.
Technical indicators:
Hourly MACD – The MACD is now gaining momentum in the bullish zone.
Hourly RSI (Relative Strength Index) – The RSI for BTC / USD is now well above the 50 level.
Major Support Levels – $ 47,000, followed by $ 46,500.
Main Resistance Levels – $ 49,000, $ 50,000, and $ 52,000.
