Bitcoin price did not stay above $ 50,000 and $ 49,000 against the US dollar. BTC is now below the 100-hour SMA and is likely to continue falling towards $ 45,000
- Bitcoin began another decline below the USD 50,000 and USD 49,000 support levels.
- The price is now trading well below $ 50,000 and the 100-hour simple moving average.
- A bearish bearish trendline is forming on the hourly chart of the BTC / USD pair (data feed from Kraken) with resistance near USD 49,000.
- The pair could extend its decline to $ 45,000 as long as it stays below $ 50,000.
Bitcoin price turns red
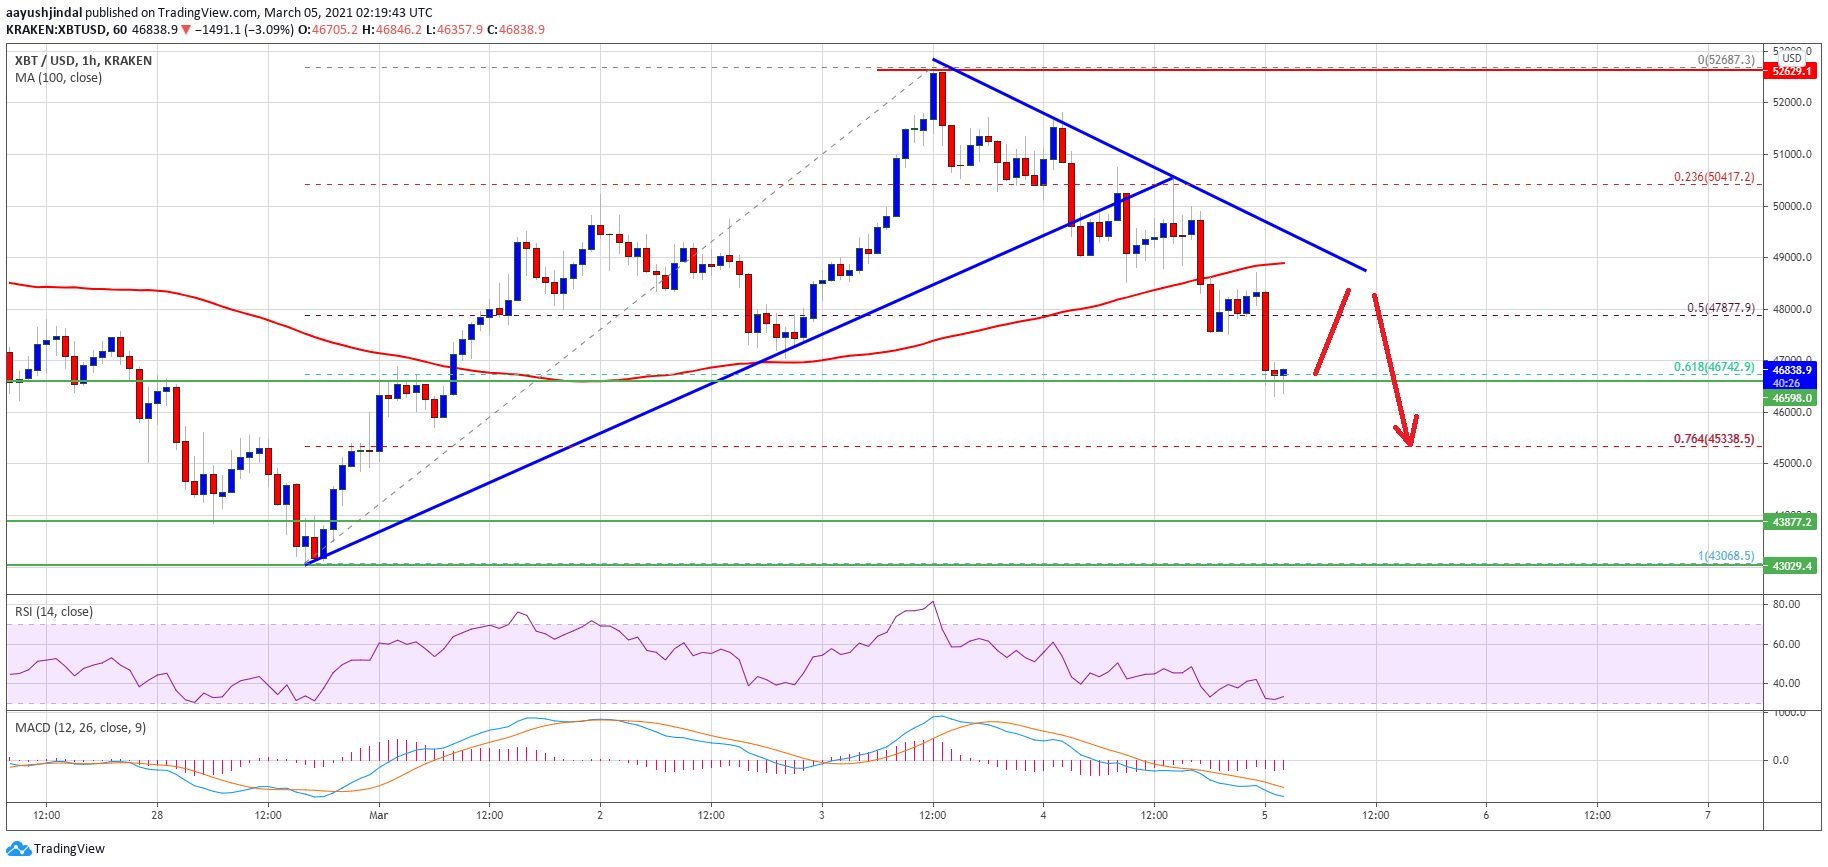
After briefly forming near the $ 52,600 level, Bitcoin began to decline again. BTC traded below the USD 51,200 and USD 50,000 support levels to move back into negative zone.
There was also a break below a major bullish trendline with support near USD 49,500 on the hourly chart for the BTC / USD pair. The pair has even surpassed the $ 48,000 support level. There was a significant break below the 50% Fib retracement level of the upside wave from the low of $ 43,050 to the high of $ 52,650.
It is now trading well below $ 50,000 and the 100-hour simple moving average. It looks like the bulls are trying to protect the 61.8% fib retracement level of the upside wave from the low of $ 43,050 to a high of $ 52,650.
Source: BTCUSD on TradingView.com
If they fail and the price trades below $ 46,500, there is a possibility of further losses. The next major support is near the $ 45,000 level, below which the bears could target a test of the $ 43,000 support zone.
New rise in BTC?
If Bitcoin stays above $ 46,500, it could correct higher. Initial resistance to the upside is near the $ 48,000 level. The first major resistance is near the $ 49,000 level and the 100-hour simple moving average.
There is also a bearish trendline forming with resistance near USD 49,000 on the same chart. To get into a positive zone, price must remove trendline resistance and then pick up pace past the $ 50,000 mark.
Technical indicators:
Hourly MACD – The MACD is now gaining momentum in the bearish zone.
Hourly RSI (Relative Strength Index) – The RSI for BTC / USD is now well below the 50 level.
Major Support Levels – $ 46,500, followed by $ 45,000.
Main Resistance Levels – $ 48,000, $ 49,000, and $ 50,000.
