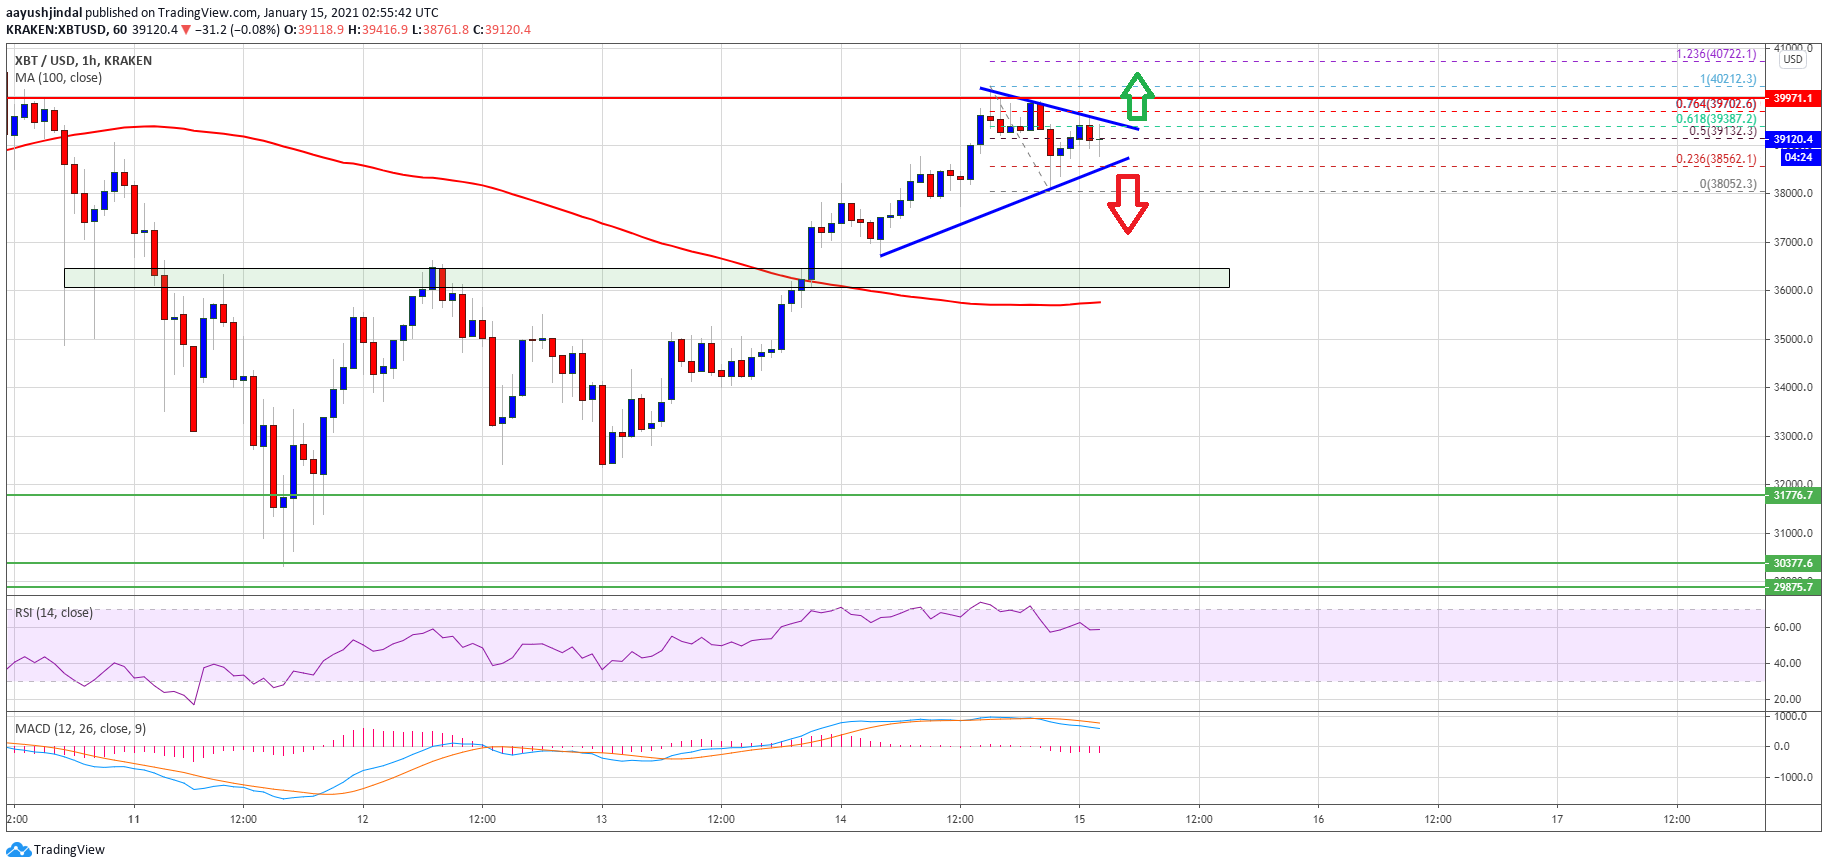
Bitcoin price continued to rebound, rising above the $ 38,000 resistance against the US dollar. BTC even surged above $ 40,000 and is likely preparing for further upward moves.
- Bitcoin stayed in good bid and managed to beat resistance levels of $ 38,000 and $ 38,500.
- The price is now trading well above the $ 38,500 level and the 100 hour simple moving average.
- A major contraction triangle is forming on the hourly chart of the BTC / USD pair (data feed from Kraken) with resistance near USD 39,425.
- The pair could rise again if it hits the $ 39,400 and $ 39,500 resistance levels in the short term.
Bitcoin price is gaining traction
After a successful hiatus and follow-up step over $ 36,000, Bitcoin price soared. BTC has cleared some key hurdles near the $ 38,000 level in order to move further into a bullish zone.
The price picked up pace, breaking the $ 39,200 resistance. It even surged above the USD 40,000 resistance and was above the 100 hour simple moving average. A high is being formed near the $ 40,212 level and the price is currently consolidating gains.
It corrected below the $ 39,500 and $ 39,200 levels. A low is being formed near the $ 38,052 level and the price is currently forming a breakout pattern. It rose above the 50% fib retracement level of the recent decline from the high of $ 40,212 to the low of $ 38,052.
A major contraction triangle appears to be forming on the hourly chart of the BTC / USD pair with resistance near USD 39,425. The triangle resistance is close to the 61.8% Fib retracement level of the recent decline from the high of $ 40,212 to the low of $ 38,052.
If there is a significant upside break above the triangle resistance, the price could hit the $ 40,000 level. In the aforementioned case, Bitcoin price could be targeting a sharp rise and the bulls are likely to target a new all-time high in the upcoming sessions.
Fresh dip in BTC?
If Bitcoin does not remove the triangular resistance and $ 40,000, it risks falling again. Initial support is near the $ 38,500 level.
A downside break below the USD 38,500 and USD 38,000 support levels could potentially push the price towards the main support area of USD 36,000 in the short term.
Technical indicators:
Hourly MACD – The MACD is slowly losing momentum in the bullish zone.
Hourly RSI (Relative Strength Index) – The RSI for BTC / USD is moving towards 50.
Major support levels – $ 38,500 followed by $ 36,000.
Main Resistance Levels – $ 39,450, $ 40,000, and $ 41,800.

