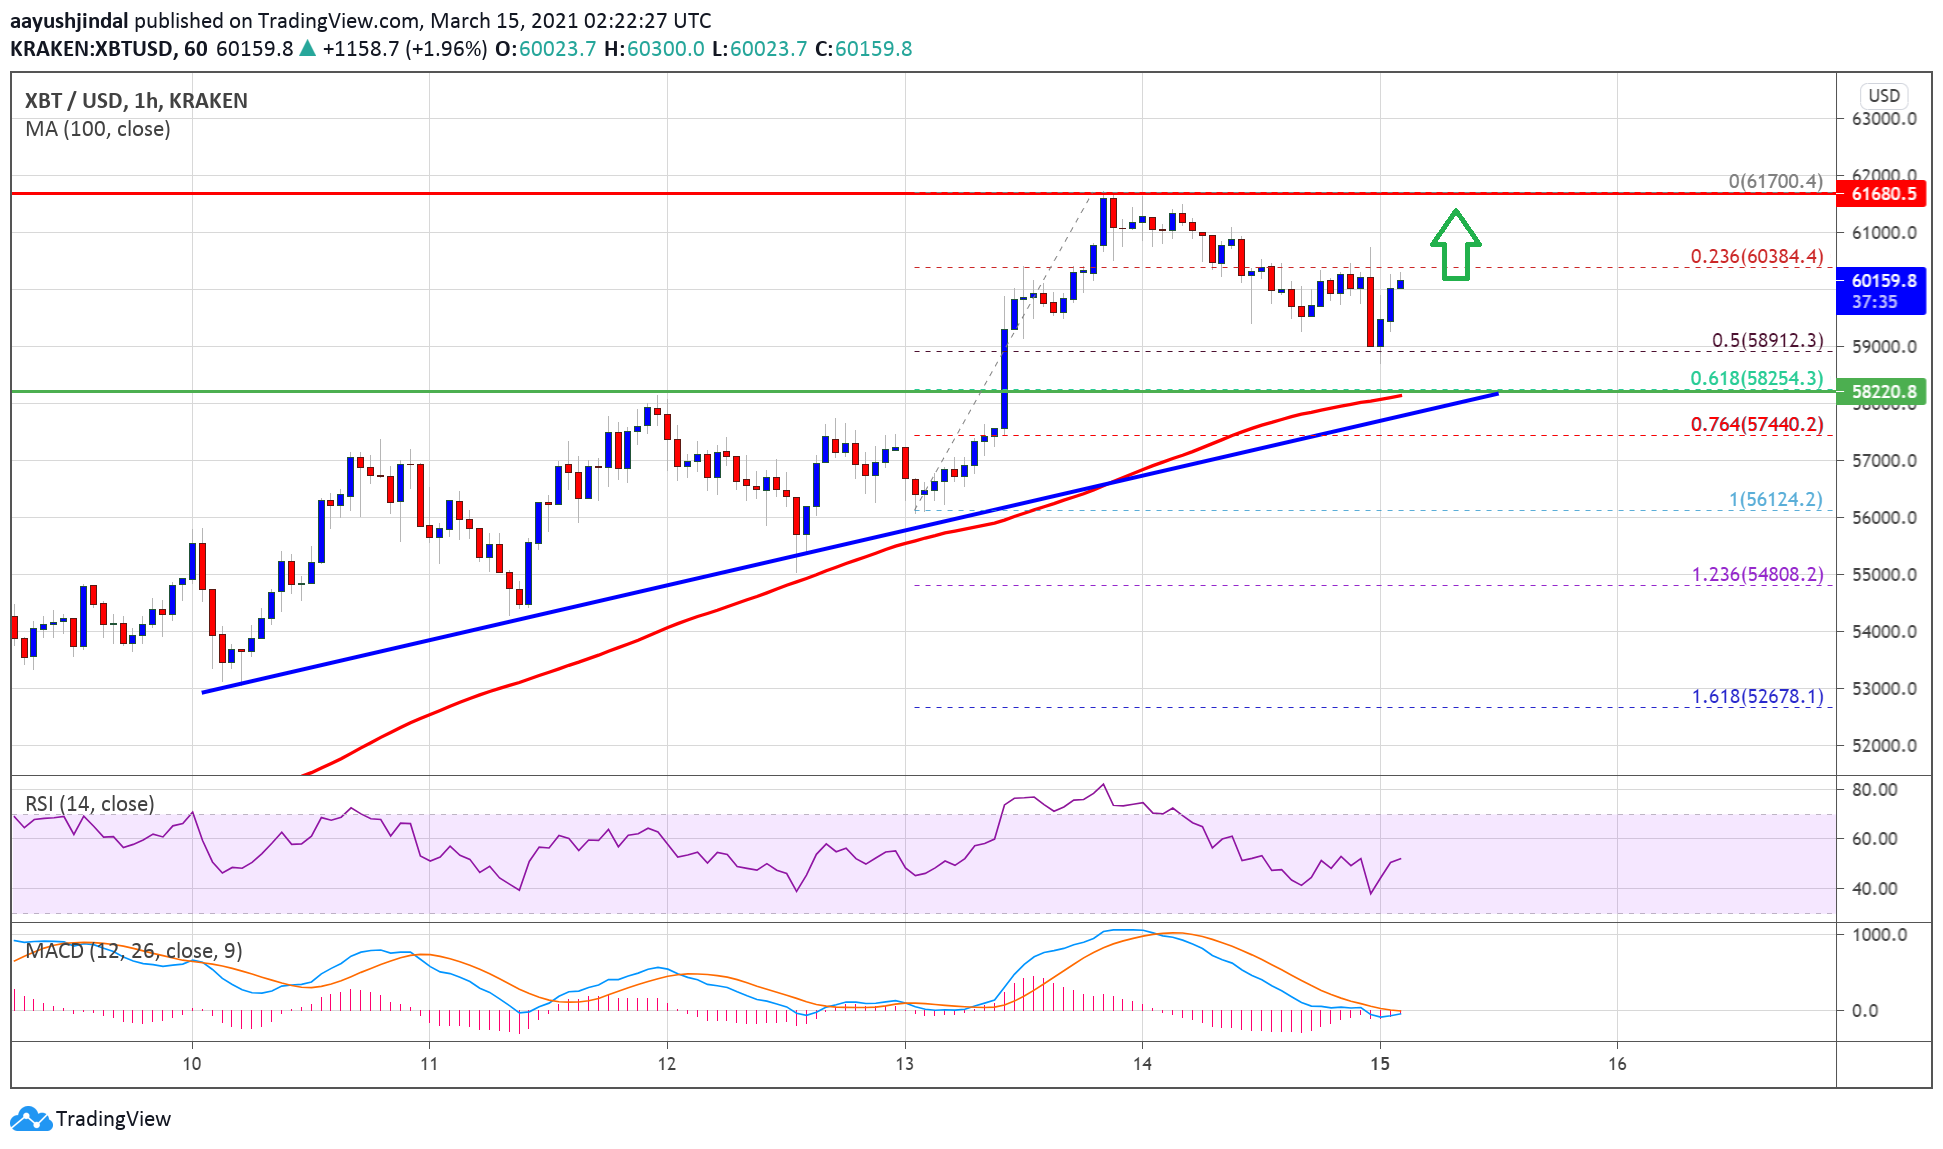
Bitcoin price began a downward correction from the high of $ 61,700 against the US dollar. BTC holds gains above the USD 58,500 and USD 58,000 support levels.
- Bitcoin gained bullish momentum above $ 60,000 and even traded above $ 61,500.
- The corrected price fell below $ 60,000 but is still well above the 100-hour simple moving average.
- A major bullish trendline is forming on the hourly chart of the BTC / USD pair (data feed from Kraken) with support near USD 58,200.
- The pair are climbing again and it seems like the bulls are likely to be aiming for a test of $ 62,000.
Bitcoin price remains in a strong uptrend
Bitcoin rose sharply above the $ 55,000 and $ 58,000 resistance levels. BTC even cleared the USD 60,000 resistance and was well above the 100 hour simple moving average.
It traded to a new all-time high near $ 61,700 before initiating a downward correction. There was a pause below the $ 61,000 support level. The price even traded below the 23.6% fib retracement level of the move up from the $ 56,124 swing low to the $ 61,700 high.
However, the bulls were active above the $ 58,500 and $ 58,800 levels. A major bullish trendline is also forming on the hourly chart for the BTC / USD pair with support near USD 58,200.
Source: BTCUSD on TradingView.com
Bitcoin also remained stable above the 50% Fib retracement level of the move up from $ 56,124 low to $ 61,700 high. It is now rising and trading well over $ 59,500. Immediate resistance is near the $ 61,000 level.
The next major resistance is near the high of $ 61,700. It seems like the price could continue to rise and even hit the $ 62,000 level in the short term.
Dips supported in BTC?
If Bitcoin fails to offset the $ 61,000 resistance, it could correct lower. The first major support on the downside is near the $ 59,000 level.
The main support is near the trend line and at $ 58,500. Further losses could require testing of the $ 58,000 support level. If there is a downside break below $ 58,000, the price could drop to the $ 56,200 level in the upcoming sessions.
Technical indicators:
Hourly MACD – The MACD is now gaining momentum in the bullish zone.
Hourly RSI (Relative Strength Index) – The RSI for BTC / USD is back above the 50 level.
Major support levels – $ 59,000 followed by $ 58,200.
Main Resistance Levels – $ 61,000, $ 61,700, and $ 62,000.
