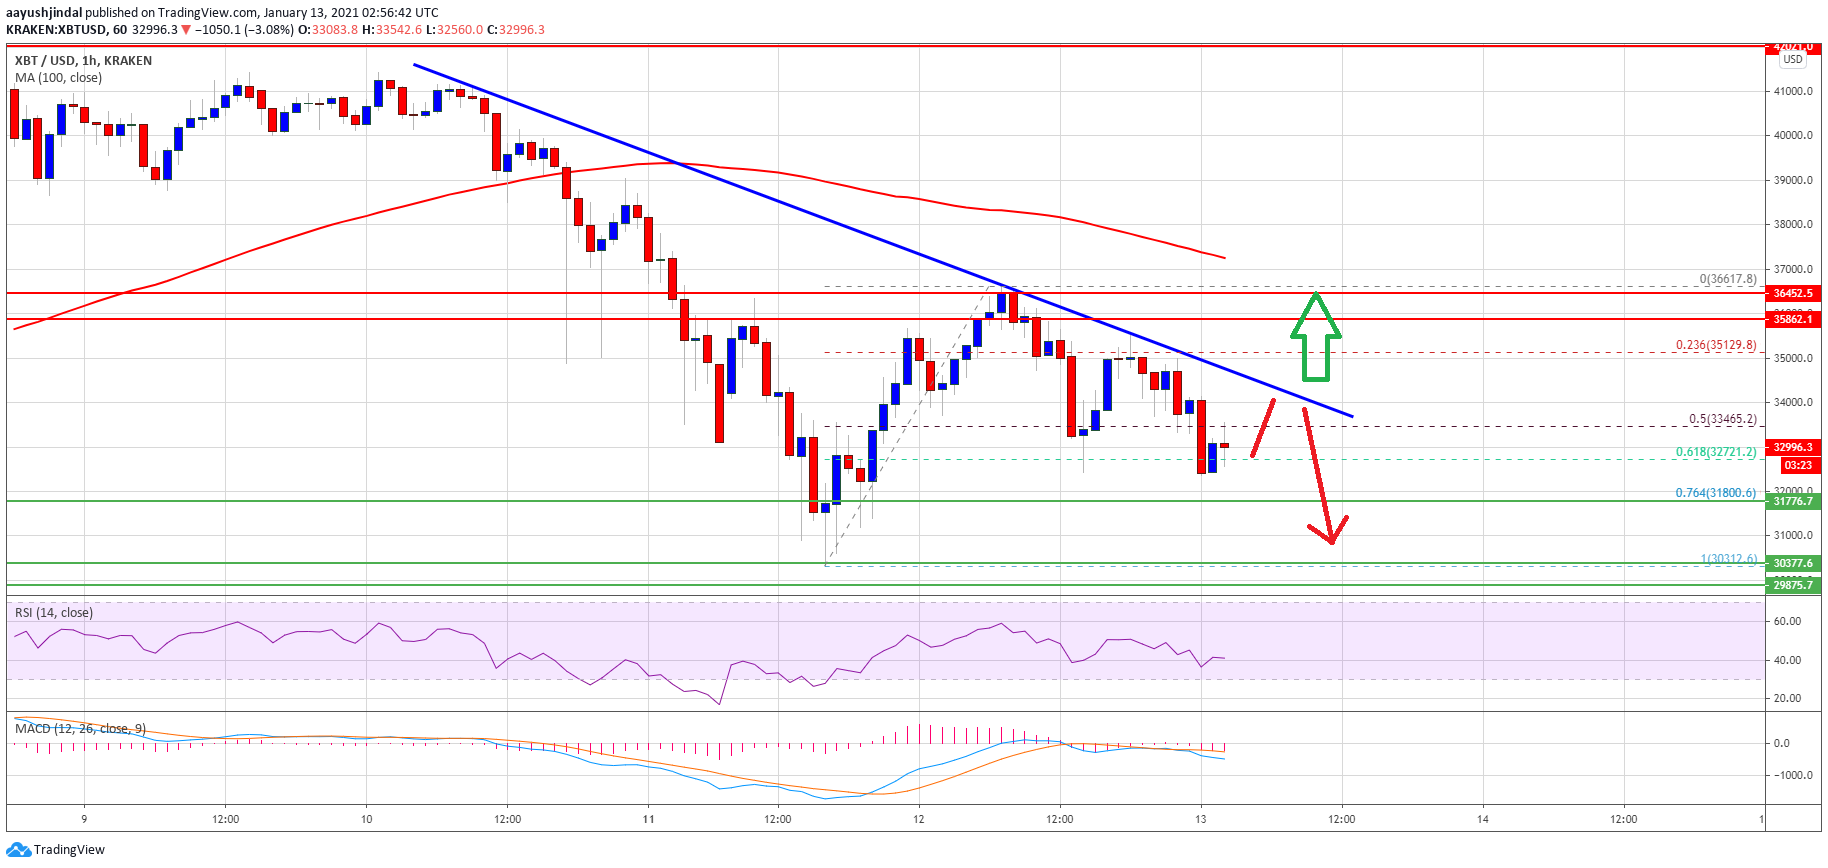
Bitcoin price failed to clear the important resistance zone of $ 36,000 against the US dollar. BTC is showing some bearish signs and could further decline towards $ 30,000.
- Bitcoin failed to gain momentum above the $ 36,000 and $ 36,200 resistance levels.
- The price is now struggling below $ 35,000 and the 100 hour simple moving average.
- A large bearish trendline is forming on the hourly chart of the BTC / USD pair (data feed from Kraken) with resistance near USD 34,600.
- The pair could continue to move towards $ 30,000 as long as it is below $ 35,000.
Bitcoin price shows bearish signs
After trading just $ 30,312, Bitcoin price rose again. BTC beat the $ 32,000 and $ 34,000 resistance levels to enter a positive zone.
The price even rose above the $ 36,000 resistance. However, there was no closing price above $ 36,200 and $ 36,500 (a major hurdle as discussed yesterday). As a result, there was a rejection near $ 36,500 and the price dropped below the $ 35,000 level.
There was a break below the $ 34,000 level and the 100 hour simple moving average. The price even broke the 50% fib retracement level of the move up from the low of $ 30,312 to the high of $ 36,617.
Source: BTCUSD on TradingView.com
A large bearish trendline is also forming on the hourly chart of the BTC / USD pair with resistance near USD 34,600. Initial downside support is near the USD 32,700 level. It is close to the 61.8% Fib retracement level of the move up from the low of $ 30,312 to the high of $ 36,617.
The next big support is near the $ 31,700 level, below which Bitcoin price may continue to decline towards the $ 30,500 and $ 30,000 levels. Further losses could move the price towards the USD 28,000 support zone.
New rise in BTC?
To get into a positive zone, Bitcoin price has to overcome many hurdles, starting at $ 34,600. The first major resistance for the bulls is near the $ 35,000 level.
The main resistance is still near the $ 36,000, $ 36,200, and $ 36,500 levels. A closing price above USD 36,500 should trigger a new rally towards USD 39,200 and USD 40,000 in the short term.
Technical indicators:
Hourly MACD – The MACD is slowly gaining momentum in the bearish zone.
Hourly RSI (Relative Strength Index) – The RSI for BTC / USD is recovering but is still below the 50 level.
Major Support Levels – $ 32,700 followed by $ 31,700.
Main Resistance Levels – $ 35,000, $ 36,000, and $ 36,500.
