Bitcoin price is struggling to remove the $ 38,000 and $ 40,000 resistance levels against the U.S. dollar. BTC is currently consolidating over $ 36,000 and continues to risk a downward break.
- Bitcoin is trading in a short-term bearish zone below the $ 38,000 and $ 40,000 resistance levels.
- Price holds major support zone near USD 35,600 and the simple moving average of 100 (4 hours).
- A large contraction triangle is forming on the 4-hour chart of the BTC / USD pair (data feed from Kraken) with support near USD 35,550.
- The pair could see a sharp decline if it hits the $ 35,500 and $ 35,000 support levels in the short term.
Profits to correct the Bitcoin price
For the past week, Bitcoin price surged well above the $ 38,000 resistance against the US dollar. The BTC / USD pair even crossed the USD 40,000 resistance but was unable to move higher.
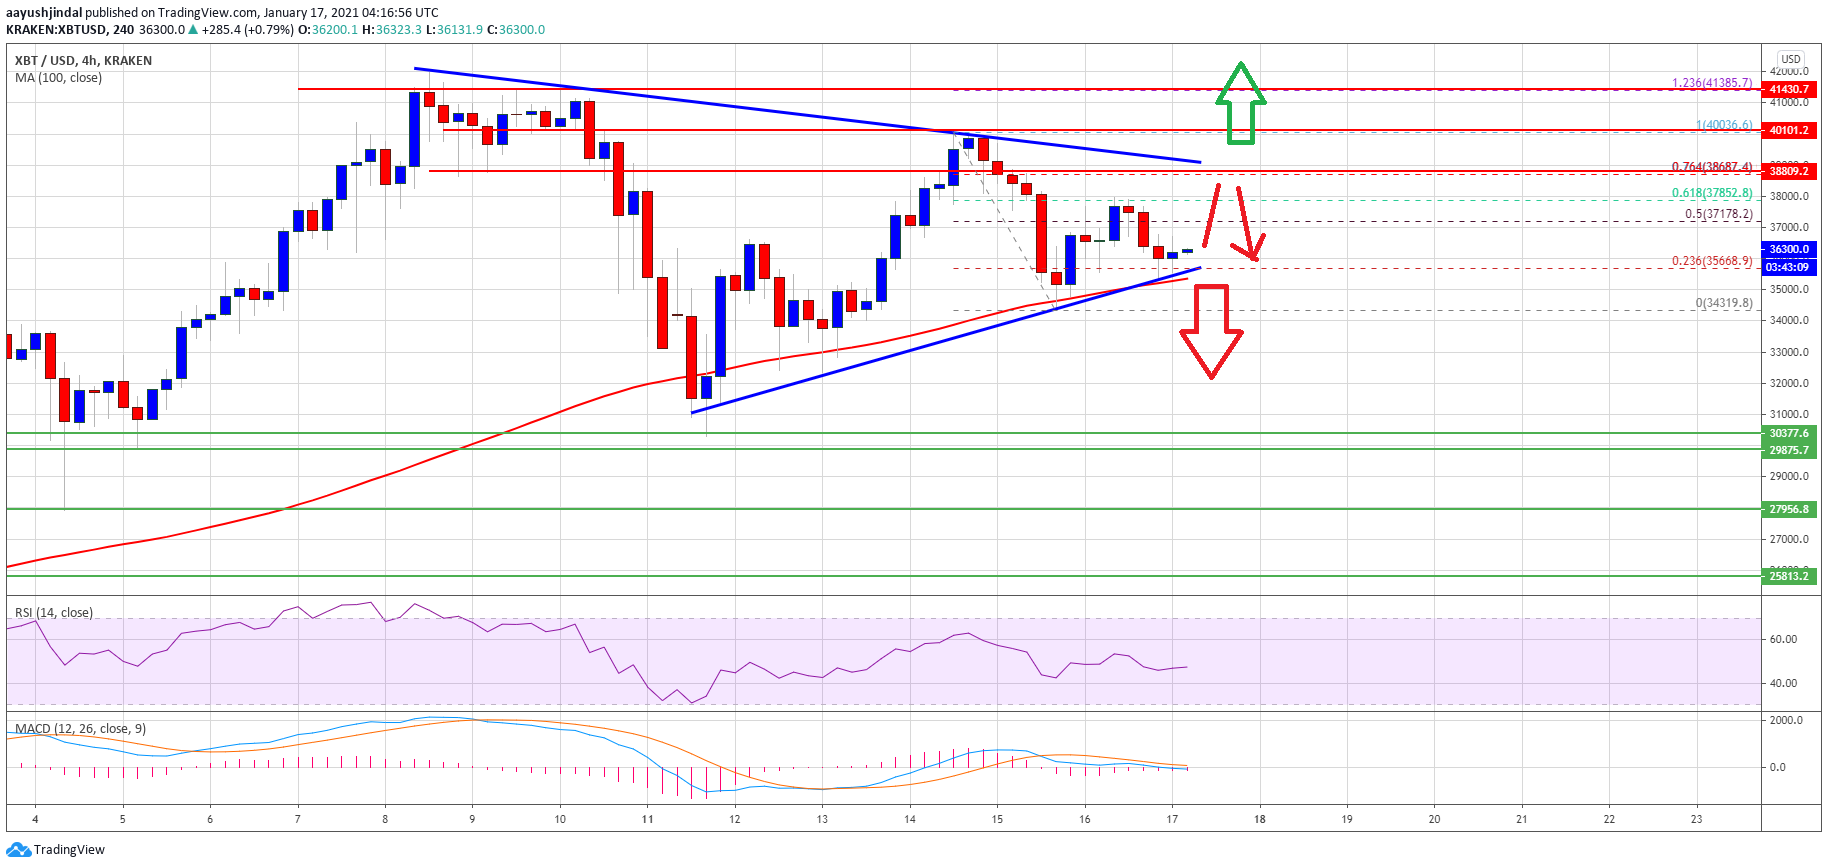
A high was formed near $ 40,036 and the price was well above the simple moving average of 100 (4 hours). Recently there was another drop and the price broke the $ 38,000 support. It even traded below the $ 36,000 level, making a low of $ 34,319.
The price is currently consolidating above the $ 35,000 level and the simple moving average of 100 (4 hours). It has already been rejected once near the 61.8% fib retracement level of the recent fall from the $ 40,036 swing high to the $ 34,319 low.
Source: BTCUSD on TradingView.com
A large contraction triangle is also forming on the 4-hour chart of the BTC / USD pair with support near USD 35,550. The triangle support is near the breakdown zone of $ 35,000 and the simple moving average of 100 (4 hours).
If there is a downside break below the USD 35,500 and USD 35,000 support levels, Bitcoin price could accelerate lower. The next big downside support is near the $ 34,000 level. Further losses could open the doors for a push towards the $ 32,000 and $ 30,000 support levels in the near future.
Upward pause at BTC?
If Bitcoin stays above the triangular support of $ 35,000 and the simple moving average of 100 (4 hours), it could push it up again.
The main resistance on the upside is near the USD 38,600 zone and the triangle’s top trendline. It is close to the 76.4% fib retracement level of the recent drop from the $ 40,036 swing high to the $ 34,319 low. A closing price above the $ 38,600 level could open the doors for a sharp move above $ 40,000.
Technical indicators
4 hours MACD – The MACD for BTC / USD is losing momentum in the bullish zone.
4 hour RSI (Relative Strength Index) – The RSI for BTC / USD is now below the 50 level.
Main support tier – $ 35,500
Main Resistance Level – $ 38,600
