Bitcoin price faces some strong hurdles near $ 36,750 and $ 37,800 against the US dollar. BTC could fall sharply if it breaks the USD 34,800 support zone.
- Bitcoin is struggling to gain positive momentum above the $ 36,750 and $ 38,000 resistance levels.
- The price is now trading well below $ 38,000 and the 100 hour simple moving average.
- A large bearish trendline is forming on the hourly chart of the BTC / USD pair (data feed from Kraken) with resistance near USD 36,400.
- The pair is likely to accelerate lower if it does not stay above the USD 34,800 support zone.
Bitcoin price with some bearish signs
After a failed attempt to settle above $ 38,000, Bitcoin price began to drop again. BTC has broken the $ 36,400 and $ 35,500 support levels to enter a short-term bearish zone.
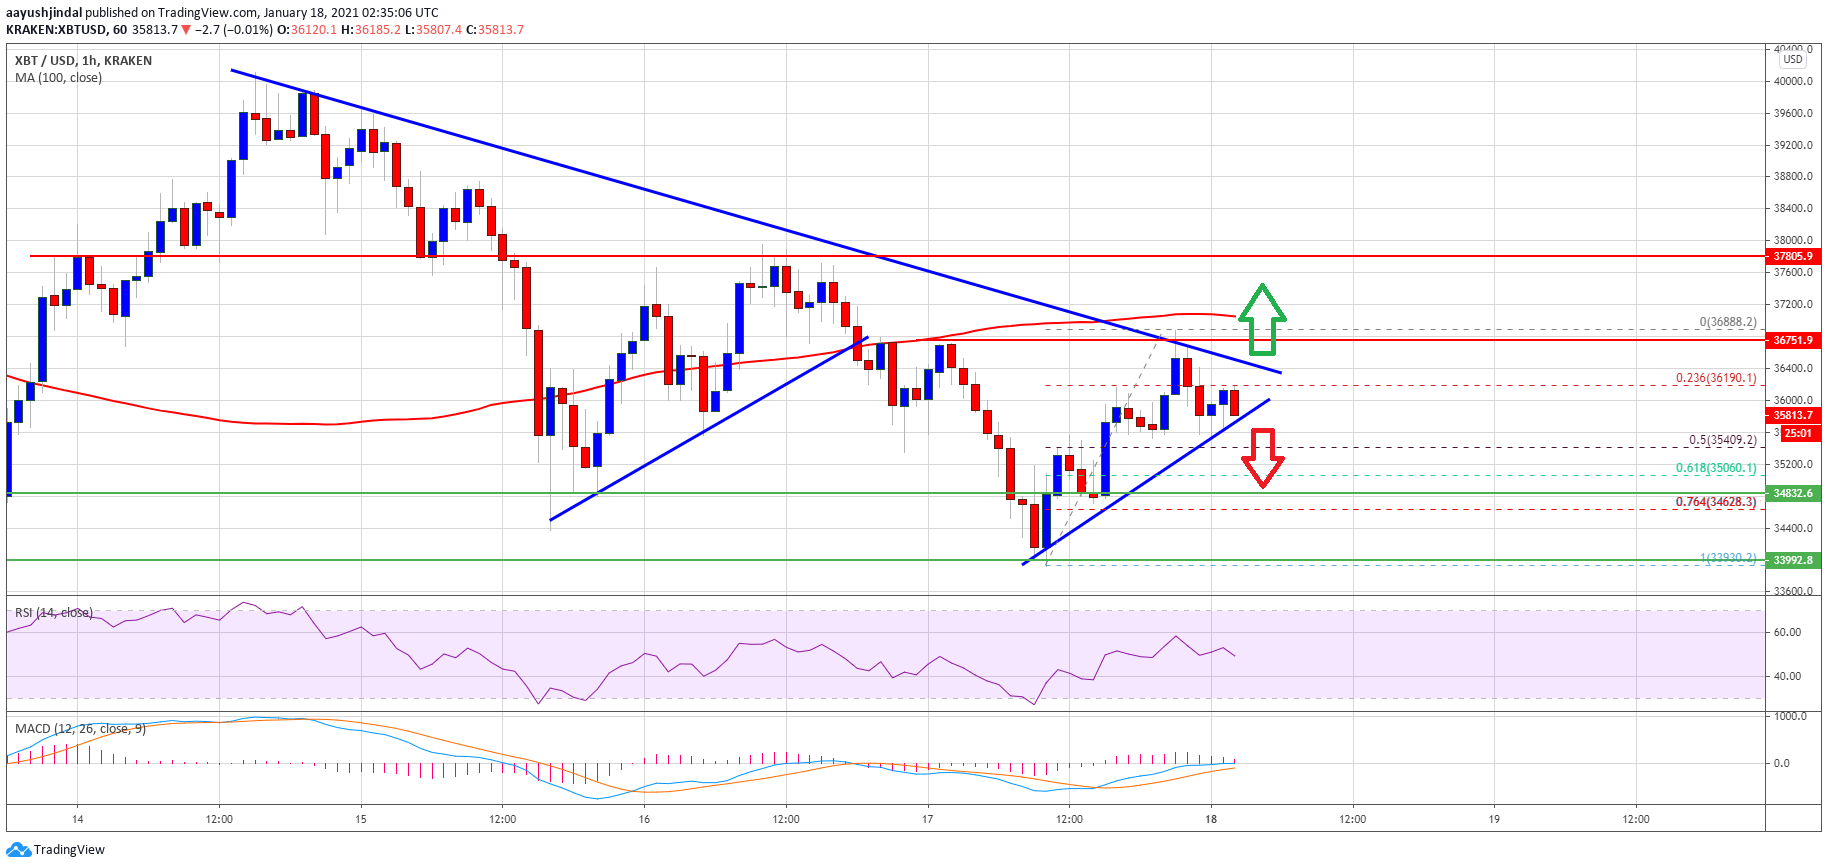
The price even got below $ 34,500 and was below the 100-hour simple moving average. A low was formed near $ 33,930 before the price began a decent upward move. It rose above $ 35,500 but appears to face strong resistance near $ 36,750.
A high is being formed near $ 36,888 and the price is currently showing some bearish signs. It has already traded below the 23.6% fib retracement level of the recent wave from the low of $ 33,930 to the high of $ 36,888.
Source: BTCUSD on TradingView.com
A large bearish trendline is also forming on the hourly chart of the BTC / USD pair with resistance near USD 36,400. On the downside, there is initial support near the USD 35,800 level and a connecting bullish trendline. A significant break below $ 35,800 could require a test of $ 35,400.
The 50% fib retracement level of the recent wave from $ 33,930 to $ 36,888 is at $ 35,400 to provide support. Further losses could accelerate the decline and Bitcoin price could drop below $ 35,000 and $ 34,500. In the specified case, there is a risk of a break below the USD 34,000 support zone.
Chances of an uptrend in BTC
If Bitcoin stays above the USD 35,800 and USD 35,400 support levels, there is a possibility of an upside break. The first major resistance is near the $ 36,750 level.
The main resistance is now forming near the $ 37,800 and $ 38,000 levels. A closing price above the USD 38,000 level is necessary to start a sharp rise in the short term towards USD 40,000 or even higher.
Technical indicators:
Hourly MACD – The MACD is slowly losing momentum in the bullish zone.
Hourly RSI (Relative Strength Index) – The RSI for BTC / USD is struggling to stay above the 50 level.
Major Support Levels – $ 35,400 followed by $ 34,000.
Main Resistance Levels – $ 36,750, $ 37,800, and $ 38,000.
