Bitcoin price prolonged its surge, removing the $ 50,000 resistance against the US dollar. BTC is now consolidating profits and is likely to continue rising above $ 52,000.
- Bitcoin is trading in a positive zone above the USD 50,000 and USD 50,500 support levels.
- The price is now trading well above $ 51,000 and the 100 hour simple moving average.
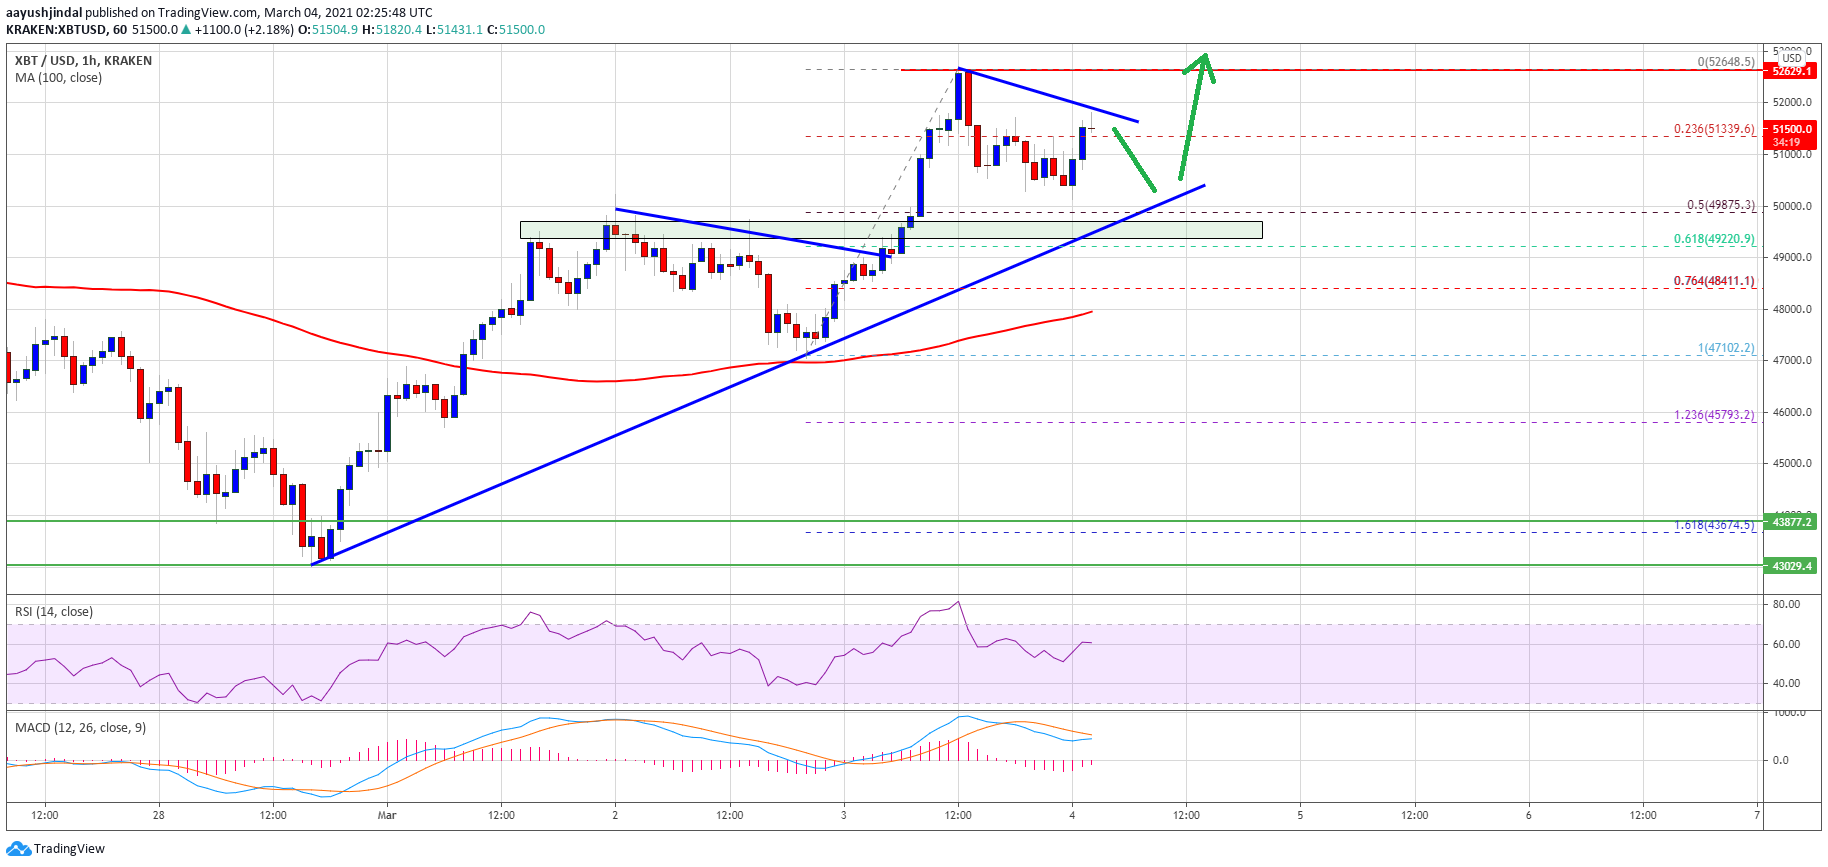
- A major bullish trendline is forming on the hourly chart of the BTC / USD pair (data feed from Kraken) with support near USD 49,800.
- The pair could extend its rally once it hits $ 52,000 and $ 52,500 in the short term.
Bitcoin price is gaining momentum
After closing above the USD 48,000 resistance, Bitcoin gained strength above the USD 50,000 main resistance. BTC has even hit the $ 51,500 level and surpassed the $ 52,000 level.
It was trading at a new monthly high near $ 52,650 and well above the 100-hour simple moving average. It is now trading in a positive zone above the USD 50,000 and USD 50,500 support levels. Recently there has been a minor correction below the $ 51,000 level.
The price traded below the 23.6% fib retracement level of the uptrend from the $ 47,102 swing low to the $ 52,648 high. However, the bulls were active near the $ 50,000 and $ 49,500 levels.
Source: BTCUSD on TradingView.com
A major bullish trendline is also forming on the hourly chart of the BTC / USD pair with support near USD 49,800. Bitcoin also stayed well above the 50% Fib retracement level of the uptrend from $ 47,102 swing low to $ 52,648 high.
It is now trading above $ 51,000 and testing a bearish trendline at $ 51,500. A sharp break above the trendline resistance could open the doors for a move towards the $ 52,500 and $ 53,200 levels. The next major resistance is near the $ 55,000 level.
Fresh dip in BTC?
If Bitcoin doesn’t stay higher than the $ 52,000 and $ 52,500 resistance levels, there could be a small decline. The first major support on the downside is near the $ 50,500 level.
The next big support is near the USD 50,000 level and the trend line. If there is a downside break below trendline support, the price could test the USD 48,000 support and the 100 hour SMA.
Technical indicators:
Hourly MACD – The MACD is now gaining momentum in the bullish zone.
Hourly RSI (Relative Strength Index) – The RSI for BTC / USD is now well above the 50 level.
Major Support Levels – $ 50,500, followed by $ 50,000.
Main Resistance Levels – $ 51,500, $ 52,000, and $ 53,200.
