Bitcoin price gained bullish momentum above the $ 50,000 resistance against the US dollar. BTC has been trading towards $ 52,000 and continues to be supported for further upward moves.
- Bitcoin started a new surge above the USD 50,000 and USD 50,500 resistance levels.
- The price is now trading well above $ 50,000 and the 100-hour simple moving average.
- A major rising channel is forming on the hourly chart of the BTC / USD pair (data feed from Kraken) with a support at USD 50,500.
- The pair could correct a few points but the bulls are likely to protect $ 50,000 and $ 49,500.
Bitcoin price starts to rise again
After a strong closing price above the $ 48,000 level, Bitcoin began rising again. BTC was able to clear key resistance levels of $ 50,000 and $ 50,500 to move into a positive zone.
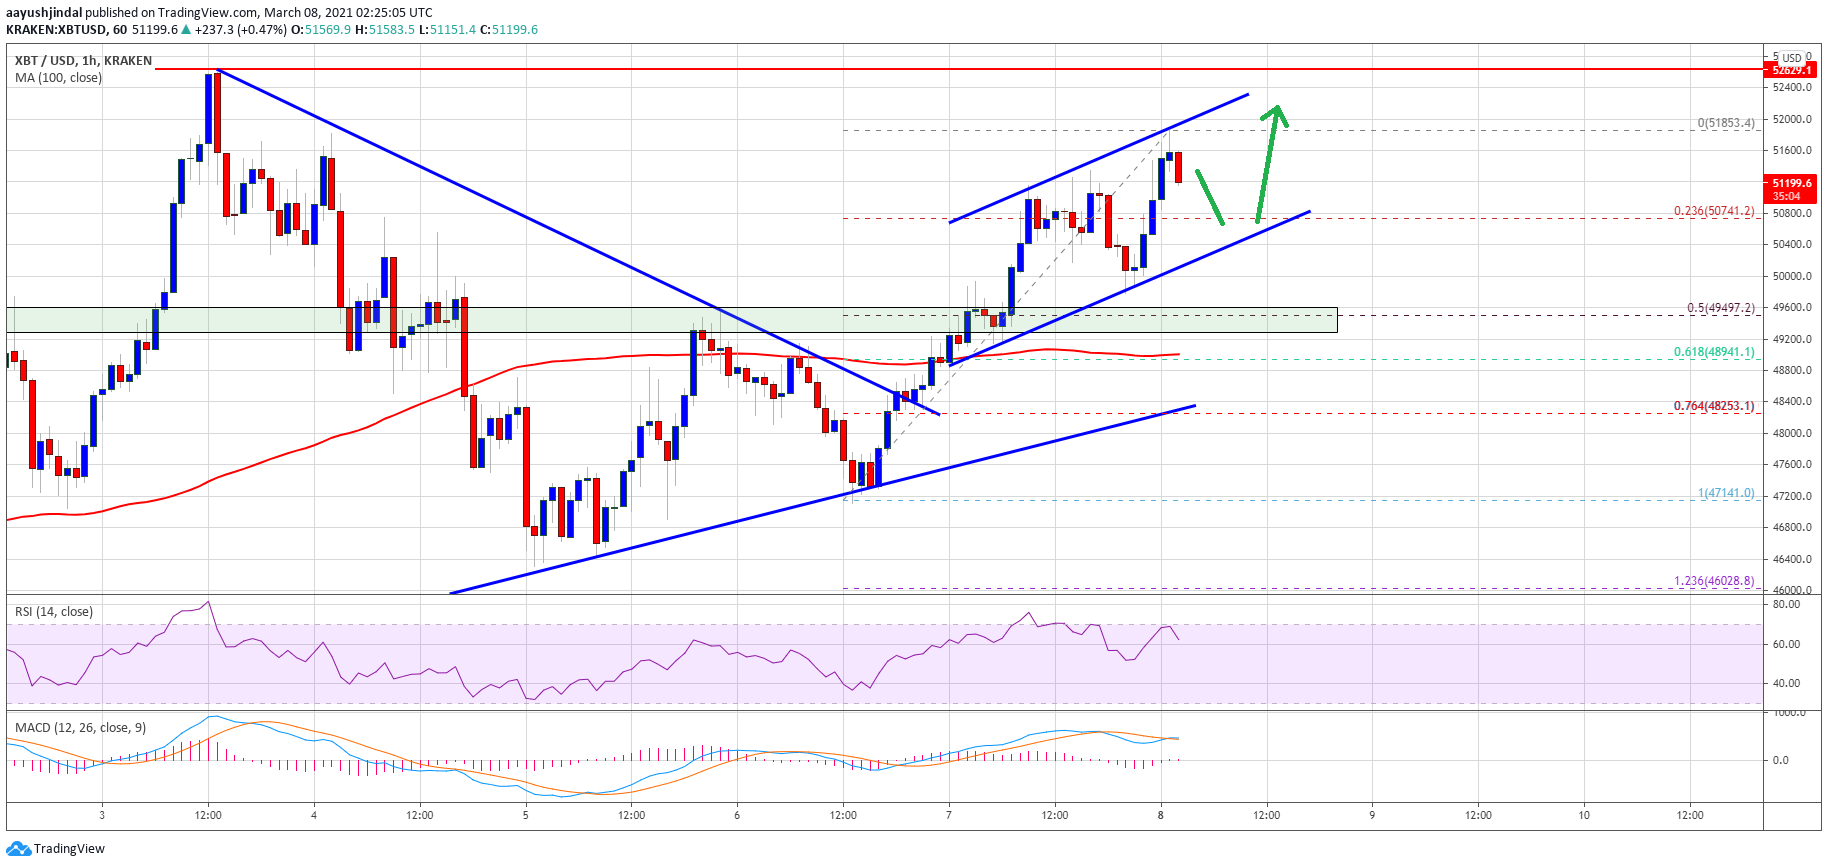
There was also a break above a major bearish trendline with resistance near USD 48,400 on the hourly chart of the BTC / USD pair. The pair extended its surge above the $ 51,000 level to hit a new weekly high of $ 51,853.
It is now correcting lower but is trading well above $ 50,000 and the 100-hour simple moving average. Initial support is near the USD 50,750 level. It is close to the 23.6% fib retracement level of the upward wave from $ 47,141 to $ 51,853.
Source: BTCUSD on TradingView.com
There is also an important rising channel forming with a support of $ 50,500 on the same chart. The next big support is near the $ 50,000 level. Further losses could potentially move price toward the 50% fib retracement level of the upward wave from $ 47,141 low to $ 51,853 high near $ 49,500. The main support is now forming near the $ 48,800 level and the 100 hour simple moving average.
Other advantages with BTC?
If Bitcoin stays above $ 50,500 and $ 49,500, it could spike again. Initial resistance to the upside is near the $ 51,500 level. The first major resistance is near the USD 52,000 level.
A successful close above the USD 52,000 resistance level could open the doors to a larger move in the upcoming sessions. The next major resistance could be $ 53,200, followed by $ 54,500.
Technical indicators:
Hourly MACD – The MACD is now gaining momentum in the bullish zone.
Hourly RSI (Relative Strength Index) – The RSI for BTC / USD is now well above the 50 level.
Major Support Levels – $ 50,500, followed by $ 50,000.
Main Resistance Levels – $ 51,500, $ 52,000, and $ 53,200.
