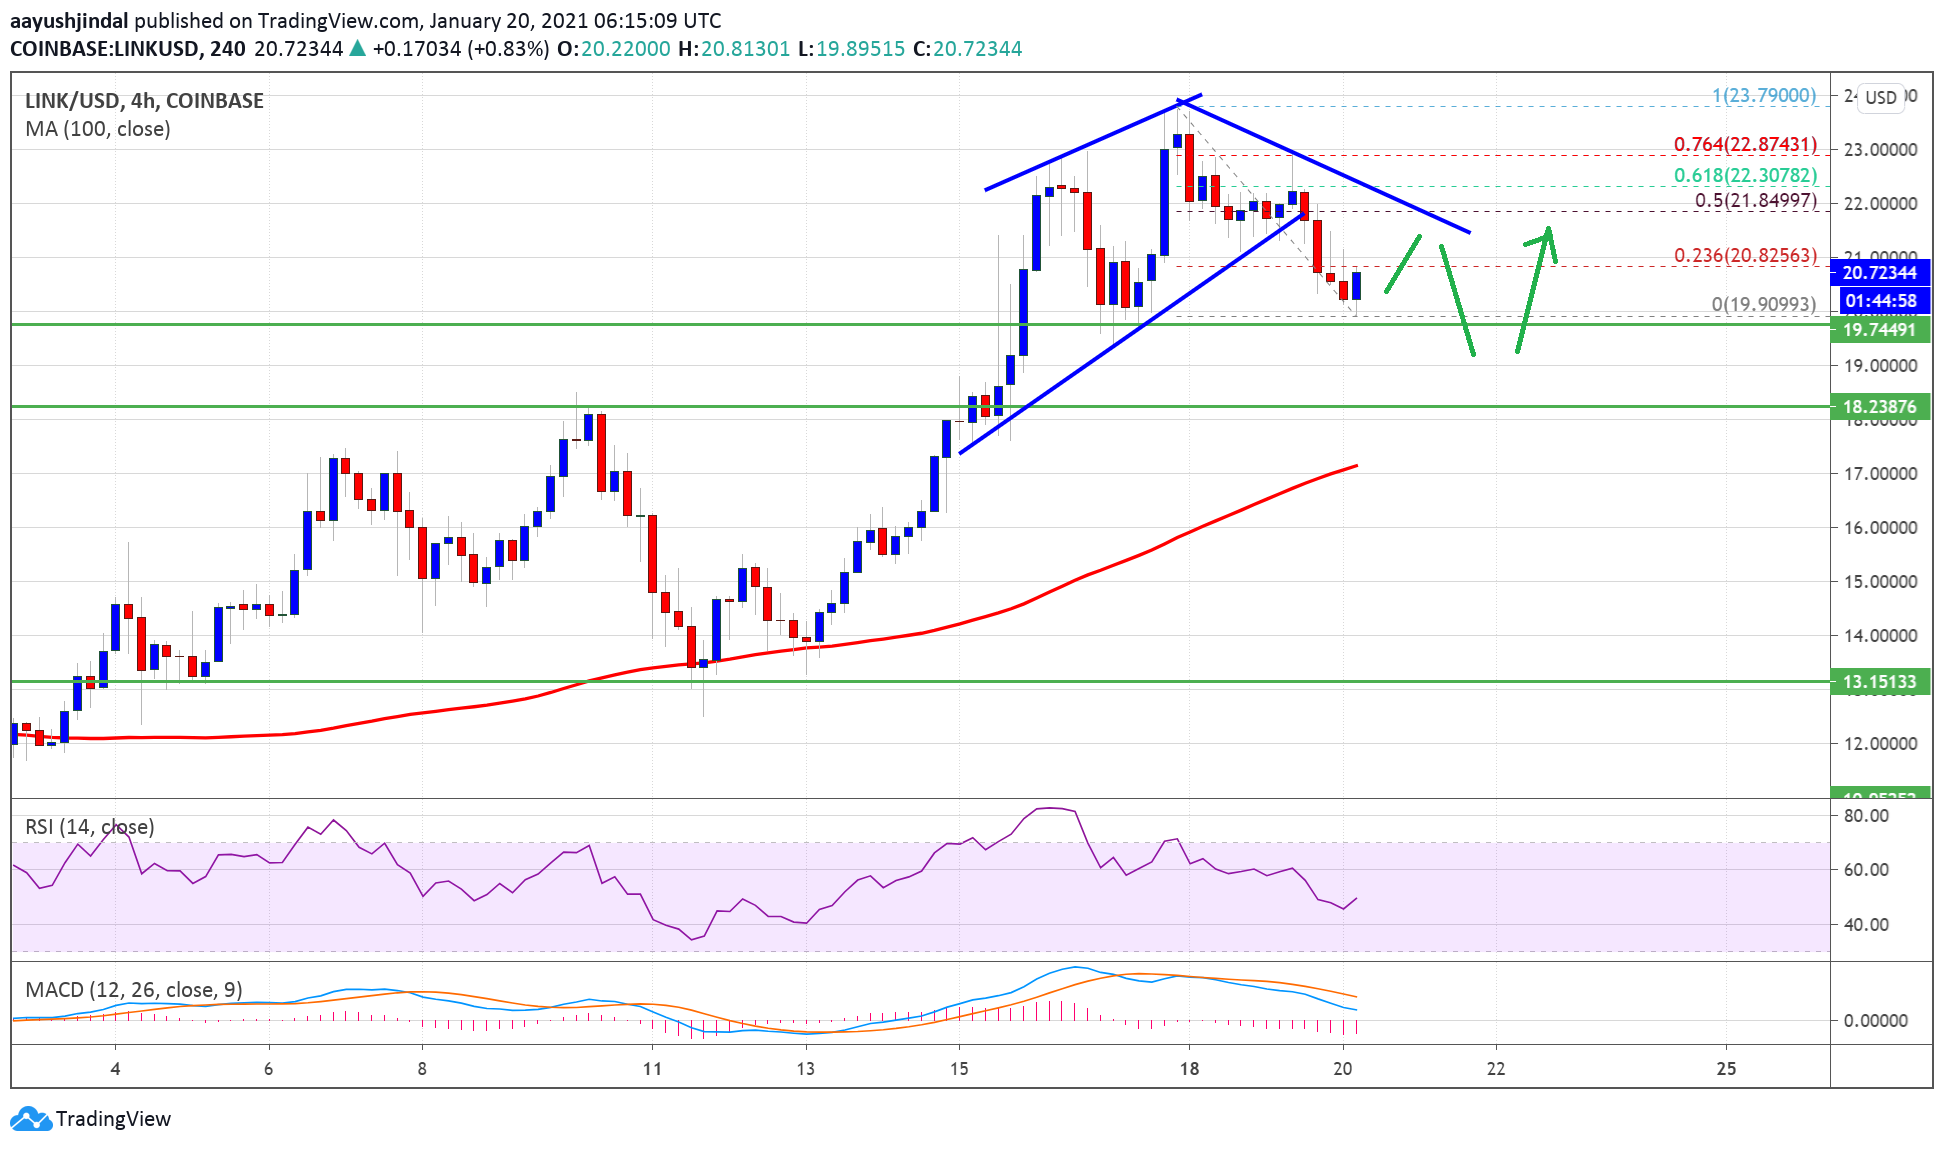
Chainlink (LINK) rose to the $ 24.00 level before correcting lower, similar to Bitcoin and Ethereum. The price is now trading near a major support zone at $ 20.00.
- Chainlink tokens were priced at $ 23.79 before a downward correction against the US dollar was initiated.
- The price is above the $ 20.00 support and well above the simple moving average of 100 (4 hours).
- A bearish bearish trendline is forming on the 4-hour chart of the LINK / USD pair (data source from Kraken) with resistance near USD 21.70.
- Price could extend losses to $ 18.20 before a new spike begins in the short term.
Chainlink (LINK) corrected below
After a significant break above USD 20.00, Chainlink (LINK) extended its rally. It even surged above the $ 22.00 level and was well above the simple moving average of 100 (4 hours).
It traded as low as $ 23.79 before initiating a downward correction. There was a pause below the $ 22.00 and $ 21.20 support levels. There was also a significant break below a contraction triangle with support near USD 21.50 on the 4 hour chart for the LINK / USD pair.
The bulls lost control and the price fell below the $ 20.50 level. The decline was limited, however, and the price traded as low as $ 19.90. LINK is now trading above the USD 20.00 support and is well above the simple moving average of 100 (4 hours).
Source: LINKUSD on TradingView.com
Initial resistance for LINK is near the USD 20.80 level. It is close to the 23.6% Fib retracement level of the recent decline from the high of $ 23.79 to the low of $ 19.90.
Additionally, a bearish trendline is forming on the same chart with resistance near $ 21.70. The trendline is close to the 50% Fib retracement level of the recent fall from the high of $ 23.79 to the low of $ 19.90. A sharp break above the trendline resistance and $ 22.00 could open the doors for a fresh push towards $ 24.00 and $ 25.00.
More losses?
If chainlink’s price doesn’t continue to climb above $ 21.70 and $ 22.00, it could correct further down. The first major support is near the USD 20.00 level.
The next big support is near the $ 18.20 level (the final breakout zone) where the bulls are likely to take a strong position in the short term.
Technical indicators
4 Hour MACD – The LINK / USD MACD is gaining momentum in the bearish zone.
4-Hour RSI (Relative Strength Index) – The RSI for LINK / USD is currently close to the 50 level.
Major Support Levels – $ 20.00, $ 19.10, and $ 18.20.
Main Resistance Levels – $ 20.80, $ 21.70, and $ 22.00.
