Ethereum holds gains above $ 1,750 against the US dollar. ETH price is likely to be poised for a crucial uptrend above the resistance levels of $ 1,850 and $ 1,880.
- Ethereum is showing some positive signs and is trading well above $ 1,750.
- The price is now well above $ 1,750 and the 100 hour simple moving average.
- A critical breakout pattern is forming on the hourly chart of ETH / USD (data feed via Kraken) with resistance near USD 1,840.
- The pair is likely to rally strongly if the closing price is above the $ 1,850 resistance.
The Ethereum price is showing positive signs
Ethereum continued to correct below the USD 1,750 support zone, while Bitcoin extended its surge. However, ETH continued to stay well bid above $ 1,720 and $ 1,700.
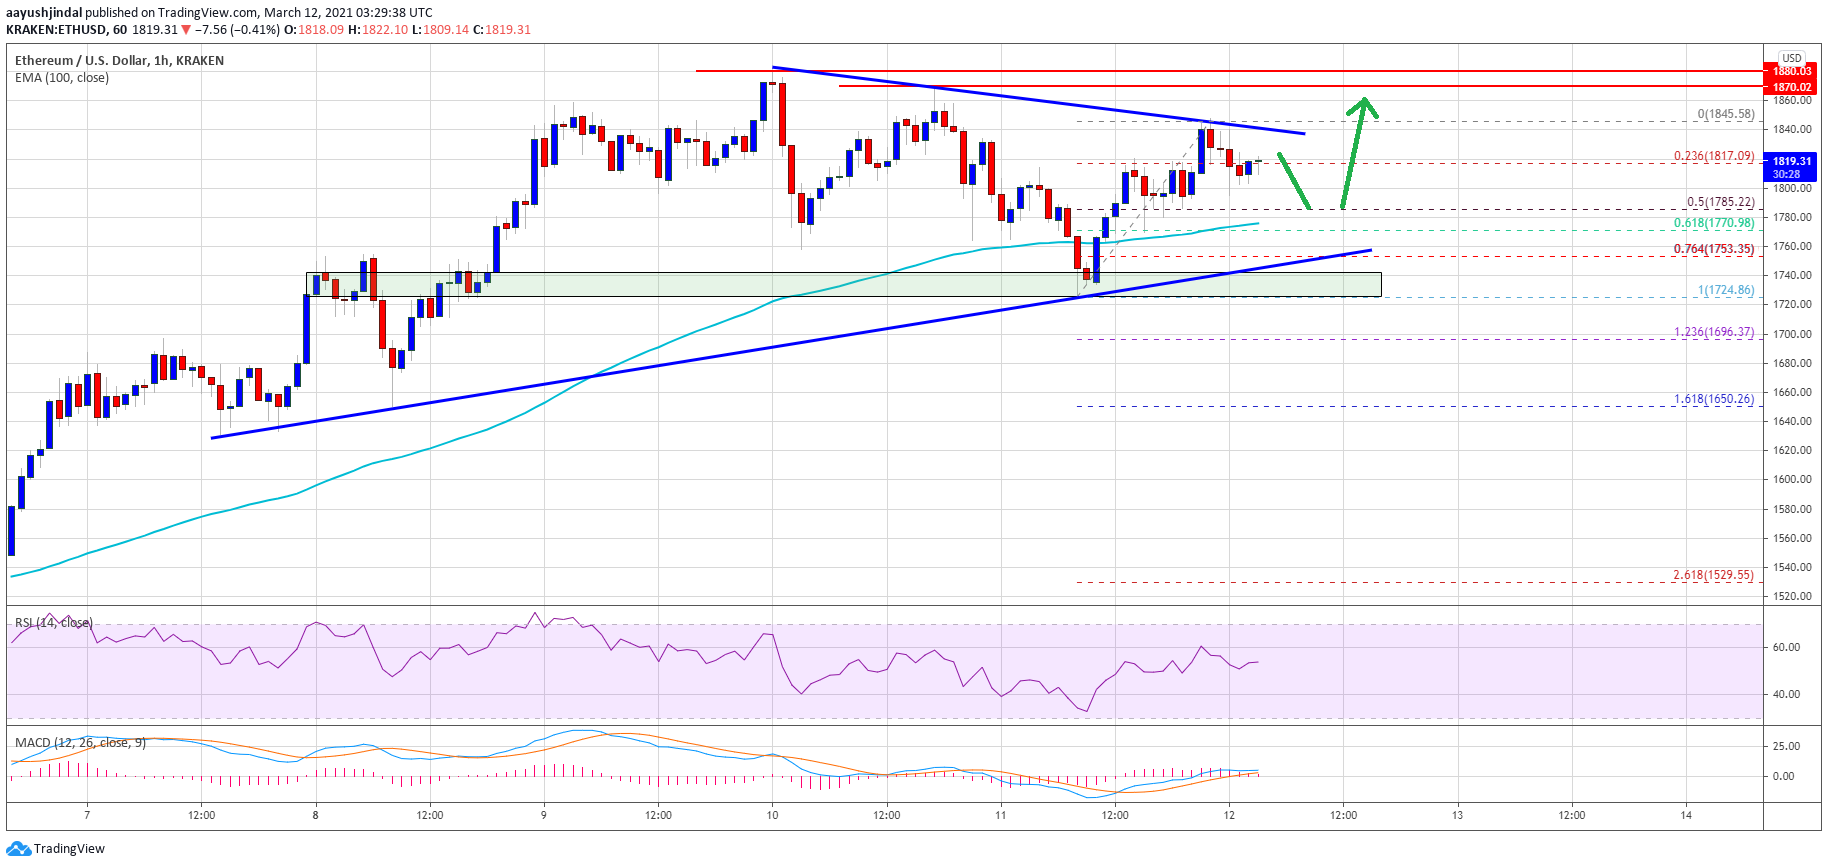
A low is being formed near $ 1,724 and the price is currently rising steadily. There was a new move above the USD 1,800 resistance level. A high is being formed near $ 1,845 and the price is currently consolidating gains. It corrected lower than the 23.6% fib retracement level of the move up from the low of $ 1,724 to the high of $ 1,845.
Ether is now well above $ 1,750 and the 100 hour simple moving average. Initial support is near the USD 1,785 level. It is close to the 50% Fib retracement level of the move up from the low of $ 1,724 to the high of $ 1,845.
Source: ETHUSD on TradingView.com
There is also a key breakout pattern with resistance near USD 1,840 on the ETH / USD hourly chart. If the price of ether clears the triangle resistance and $ 1,850, it could see a sharp spike. In the aforementioned case, the price could move towards the USD 1,900 and USD 1,920 resistance levels. The next big stop for the bulls could be $ 2,000.
Downward break at ETH?
If Ethereum doesn’t stay higher than the $ 1,840 and $ 1,850 resistance levels, it could correct further lower. The first major support is near the $ 1,785 level.
The main support is now forming near the USD 1,750 level and the lower trendline of the triangle. If there is a downside break below the USD 1,750 support, the ether price could fall towards the USD 1,725 level.
Technical indicators
Hourly MACD – – The MACD for ETH / USD is slowly gaining pace in the bullish zone.
Hourly RSI – – The RSI for ETH / USD is now above the 50 level.
Main support tier – $ 1,750
Main Resistance Level – $ 1,850
