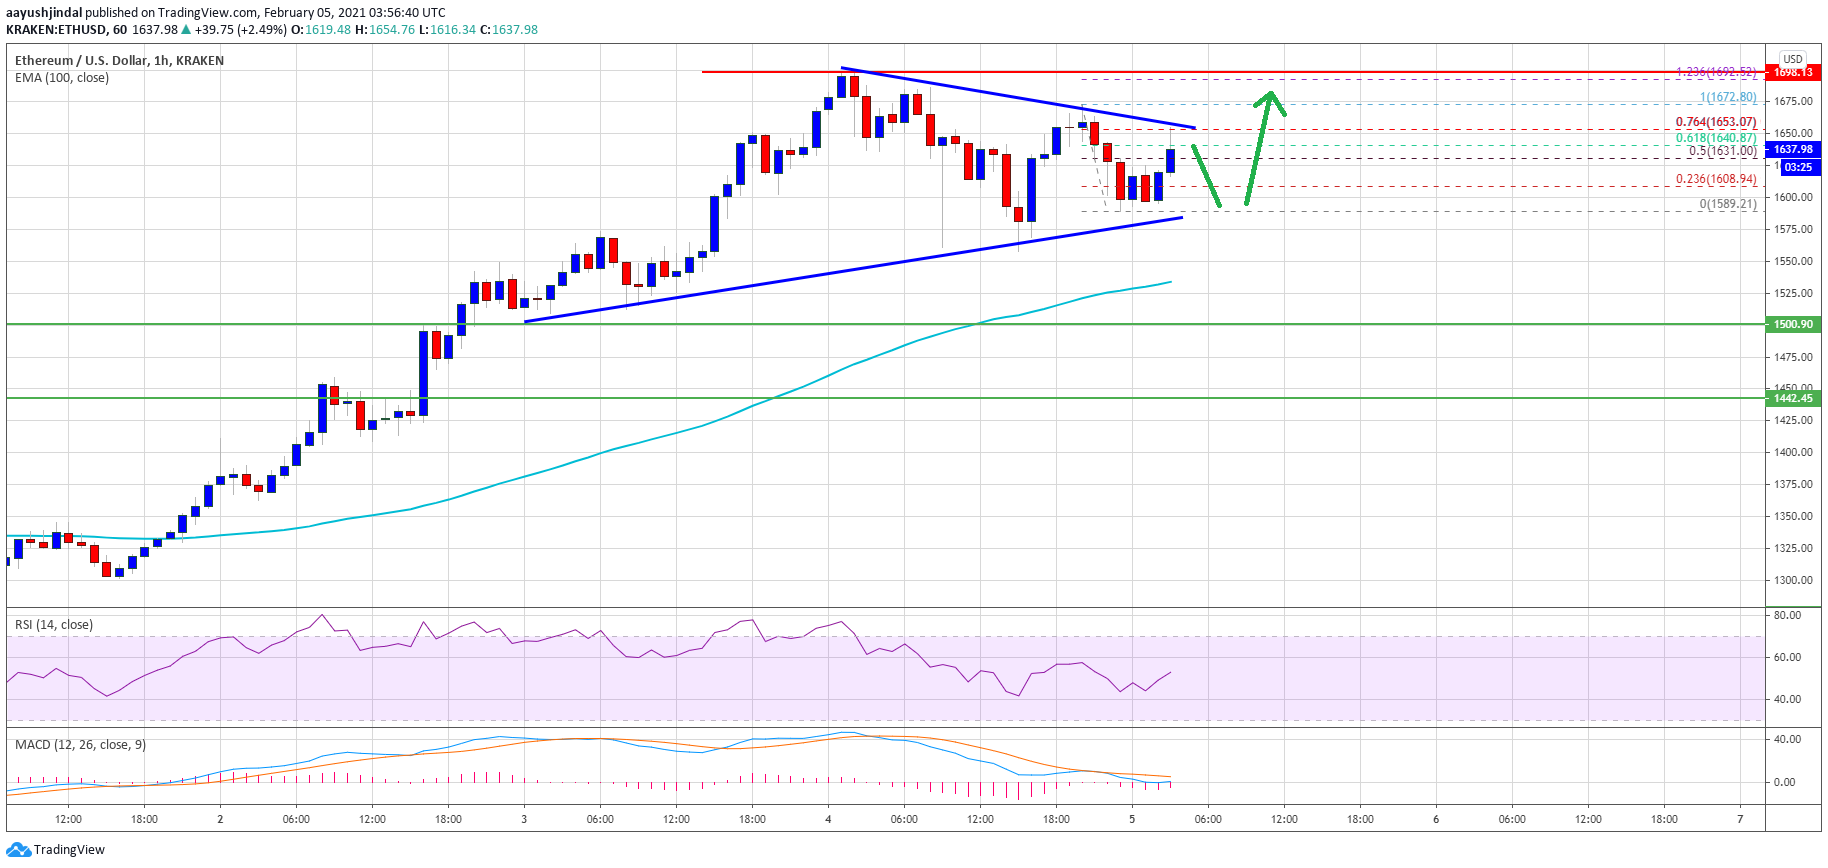
Ethereum started a downward correction from a new all-time high of $ 1,697 against the US dollar. ETH price is holding gains above $ 1,600 and could usher in a new spike.
- Ethereum started a downward correction below the USD 1,650 and USD 1,620 levels.
- The price is still trading well above $ 1,600 and the 100-hour simple moving average.
- A major contraction triangle is forming on the hourly chart of ETH / USD (data feed via Kraken) with resistance near USD 1,655.
- The pair is likely to move higher again once it hits the $ 1,655 and $ 1,660 resistance levels in the short term.
The price of the Ethereum remains stable
After reaching a new all-time high near $ 1,697, Ethereum began a short-term downward correction. ETH traded below the support levels of $ 1,650 and $ 1,620. There was also a spike below the $ 1,600 level, but the price rebounded quickly.
Ether is now trading well above $ 1,600 and the 100 hour simple moving average. The recent swing low was formed near $ 1,589 before the price surged above $ 1,620.
There was a break above the 50% fib retracement level of the recent drop from the high of $ 1,672 to the low of $ 1,589. It appears that a major contraction triangle is forming on the hourly chart of ETH / USD with resistance near USD 1,655.
Source: ETHUSD on TradingView.com
The triangle resistance is close to the 76.4% fib retracement level of the recent decline from the high of $ 1,672 to the low of $ 1,589. If the closing price is at $ 1,655 and $ 1,660 above the triangular resistance, the ether price could rise again.
In that case, it could even exceed the USD 1,700 level in the short term. The next major resistance for the bulls above $ 1,700 could be $ 1,735 (a major Fib expansion level).
Do you keep ETH? There is a brand new real-time notification system that notifies you of incoming / outgoing transactions from any address offered by Ethplorer or any token contract. The company’s monitoring service will automatically monitor the addresses you choose and send you a real-time notification when that address conducts a transaction. You can monitor inbound transactions, outbound transactions, or both.
Dips supported at ETH?
If Ethereum fails to hit the resistance level of $ 1,655 and the upper trendline of the triangle, it could correct further down. On the flip side, initial support is near the lower trendline of the triangle at $ 1,585.
A downside break below the triangle support could push the price towards the USD 1,550 support area. Further losses should push the price towards the USD 1,500 support region in the coming sessions.
Technical indicators
Hourly MACD – – The MACD for ETH / USD is slowly gaining momentum in the bullish zone.
Hourly RSI – – The RSI for ETH / USD is currently just above the 50 level.
Main support tier – $ 1,585
Main Resistance Level – $ 1,660
