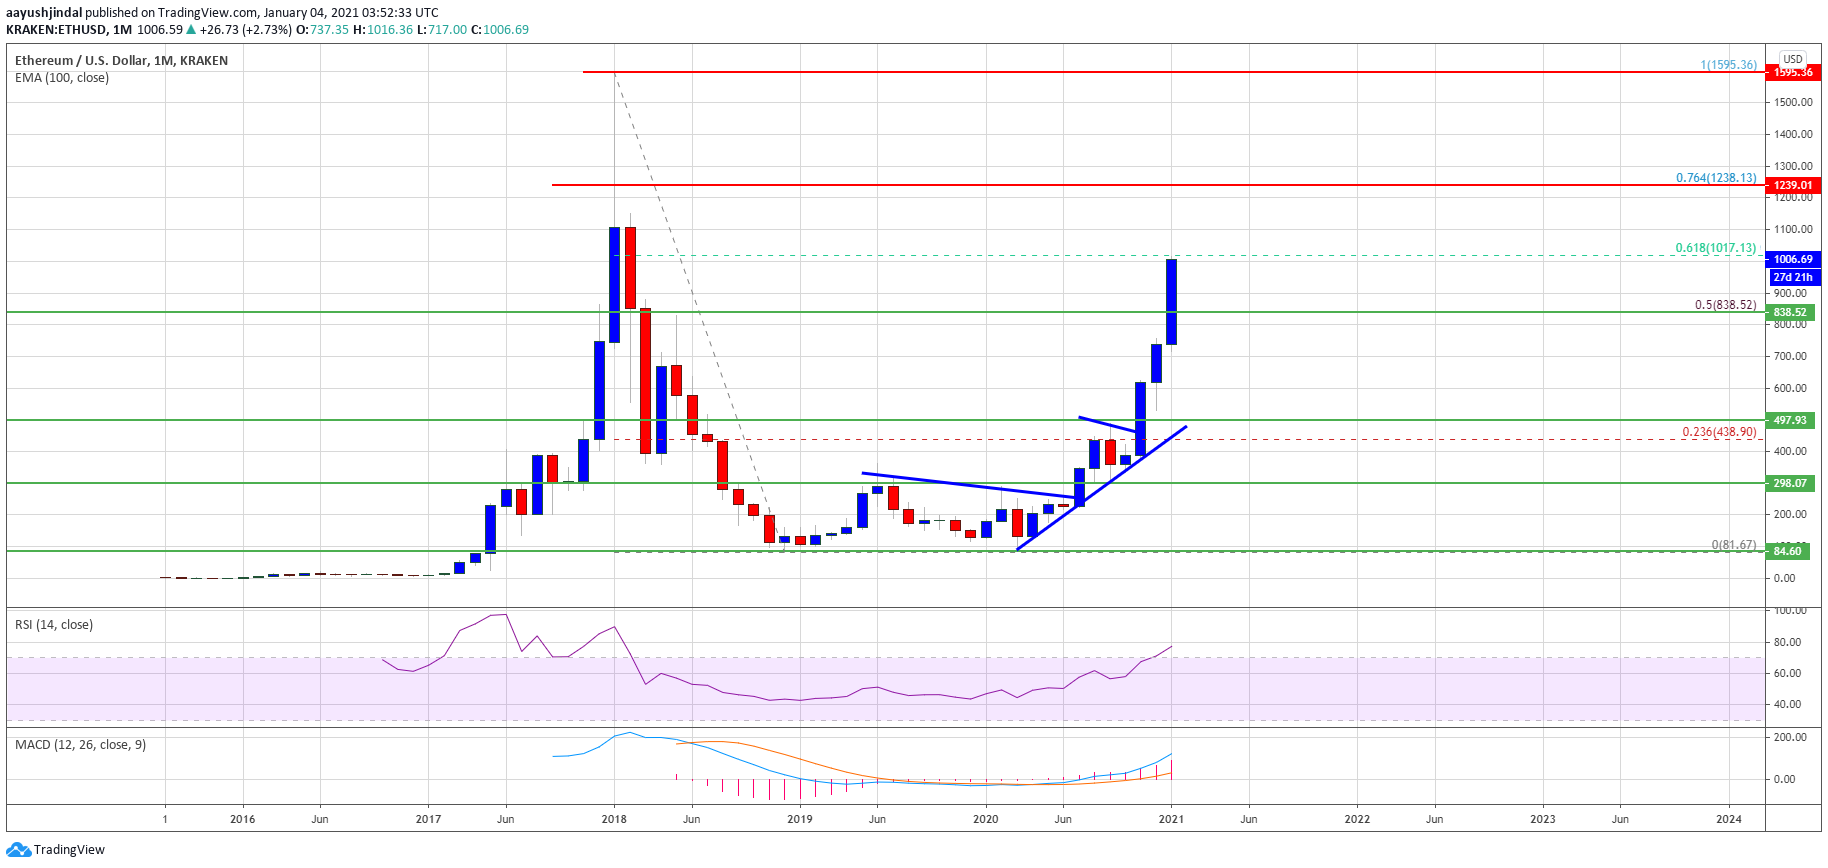
Ethereum rose over 25% and even broke $ 1,000 against the US dollar. The ETH price is moving in a strong upward trend and the monthly chart indicates a short-term test of USD 1,200.
- Ethereum is on the rise and has broken many hurdles near $ 800 and $ 900.
- The price is now trading above the $ 1,000 level and 100-month simple moving average.
- There was a pause on the monthly chart of ETH / USD (data feed via Kraken) above some bullish continuation patterns near USD 500.
- The pair is likely to remain above the $ 1,050 and $ 1,120 resistance levels in the short term.
Price increase in Ethereum by 25%
In the past two days there has been a massive surge in Ethereum above the USD 700 resistance level. The ETH price rose over 25% and broke many important hurdles near the $ 800 zone.
Initially, there was a break above a couple of bullish continuation patterns near USD 500 on the ETH / USD monthly chart. It opened the doors to a steady surge above $ 600 and $ 700. There was also a decent closing price above the $ 750 level and the 100-month simple moving average.
Ether price rose well above the 50% fib retracement level of the main decline from $ 1,595 all-time high to $ 82 swing low. The price is now trading well above the USD 950 and USD 1,000 levels.
Source: ETHUSD on TradingView.com
It tests the 61.8% fib retracement level of the main decline from $ 1,595 all-time high to $ 82 swing lows. It appears that the bulls are aiming for a significant break above the $ 1,050 and $ 1,080 levels. If they succeed, the next big stop for them could be near the $ 1,200 or $ 1,238 level.
The 76.4% fib retracement level of the main decline from $ 1,595 all-time high to $ 82 swing lows is close to $ 1,238 to act as a short-term hurdle. Further upside moves could require a push towards the all-time high of $ 1,595 (formed on Kraken).
Dips supported at ETH?
If Ethereum fails, a downward correction will start and initial downward support could be near the $ 950 level. The first major support is near the $ 920 level.
The main breakout zone was near $ 840 which is now likely to be strong support. Further losses could require a test of the $ 750 level.
Technical indicators
Monthly MACD – – The MACD for ETH / USD is picking up pace in the bullish zone.
Monthly RSI – – The RSI for ETH / USD is now above the 60 level.
Main support tier – $ 840
Main Resistance Level – $ 1,238
