Ethereum hit a new monthly high of $ 1,655 before correcting against the US dollar. ETH price is struggling to stay above $ 1,600, but it is likely to remain stable as long as it is above the 100-hour SMA.
- Ethereum has extended its surge above the $ 1,600 and $ 1,625 resistance levels.
- The price is now correcting below $ 1,600 and approaching the 100-hour simple moving average.
- A major bullish trendline is forming on the hourly chart of ETH / USD (data feed via Kraken) with support near USD 1,550.
- The pair could either drop well below $ 1,550 or start a fresh spike above $ 1,620.
Ethereum price remains supported
Ethereum extended its recovery wave above the key resistance level of $ 1,600. ETH even exceeded the resistance level of $ 1,625 and settled well above the simple 100-hour moving average.
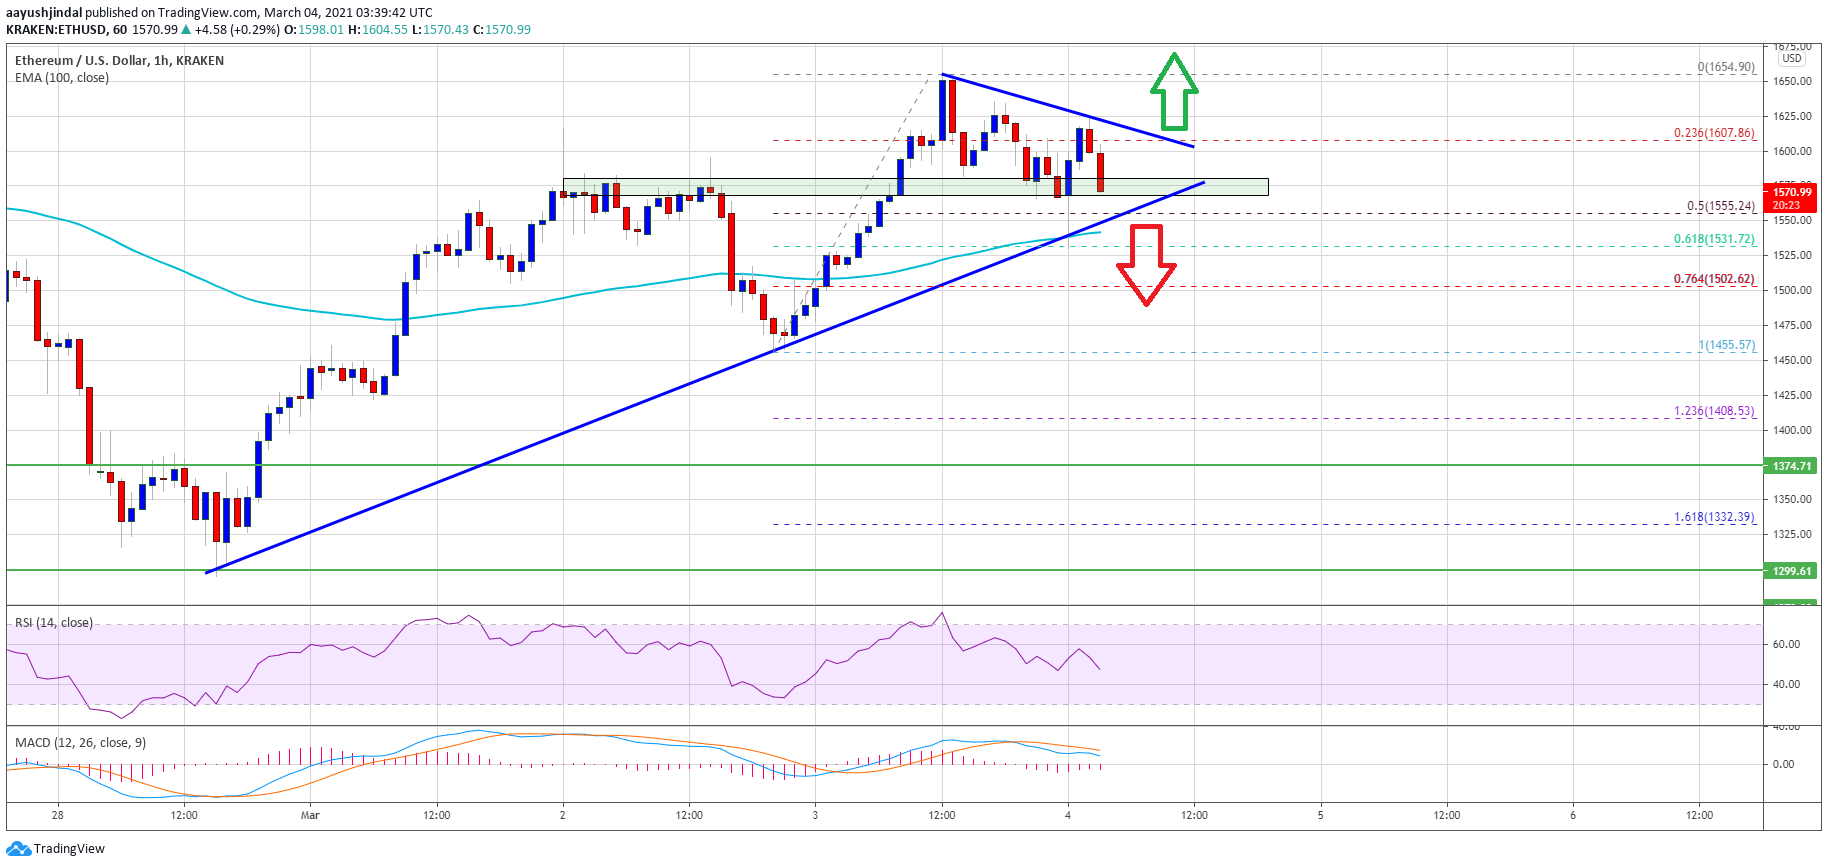
It traded to a new monthly high near $ 1,655 before initiating a downward correction. There was a break below the Fib retracement level of 23.6% in the move up from the low of $ 1,455 to the high of $ 1,655. Ether is now correcting below $ 1,600 and approaching the 100 hour simple moving average.
Immediate support is near the $ 1,555 level. It is close to the 50% Fib retracement level of the move up from the low of $ 1,455 to the high of $ 1,655. There is also a large bullish trendline with support near USD 1,550 on the ETH / USD hourly chart.
Source: ETHUSD on TradingView.com
On the upside, the price faces hurdles near $ 1,600 and $ 1,615. There is also a bearish trendline forming with resistance near USD 1,610 on the same chart.
If there is a significant break above $ 1,600 and trendline resistance, there could be a steady rise. The next major resistance is near the $ 1,650 level above which $ 1,685 could be tested.
Fresh drops at ETH?
Unless Ethereum continues above the $ 1,600 and $ 1,610 resistance levels, it could resume its decline. Initial support to the downside is near the USD 1,550 level and the trend line.
The first major support comes near the $ 1,540 zone and the 100 hour SMA. A downtrend below the $ 1,550 and $ 1,540 levels could open the doors for a move towards the $ 1,500 level.
Technical indicators
Hourly MACD – – The MACD for ETH / USD is losing pace in the bullish zone.
Hourly RSI – – The RSI for ETH / USD is now approaching the 50 level.
Main support tier – $ 1,550
Main Resistance Level – $ 1,610
