Ethereum struggled to remove the $ 1,400 resistance and fell to $ 1,275 against the US dollar. ETH price is struggling but could rebound once there is a significant break above USD 1,350.
- Ethereum hit near the $ 1,375 level before falling back to $ 1,275.
- The price is now trading below the $ 1,350 pivot level and the 100-hour simple moving average.
- An important bearish trendline is forming on the hourly chart of ETH / USD (data feed via Kraken) with resistance near USD 1,345.
- The pair could see a sharp rise if short term clears the $ 1,350 resistance zone.
The Ethereum price is facing hurdles
After a failed attempt near $ 1,400, Ethereum launched a new bearish wave. ETH price was near the $ 1,375 level before falling nearly $ 100. There was a pause below the $ 1,350 support level and the 100 hour simple moving average.
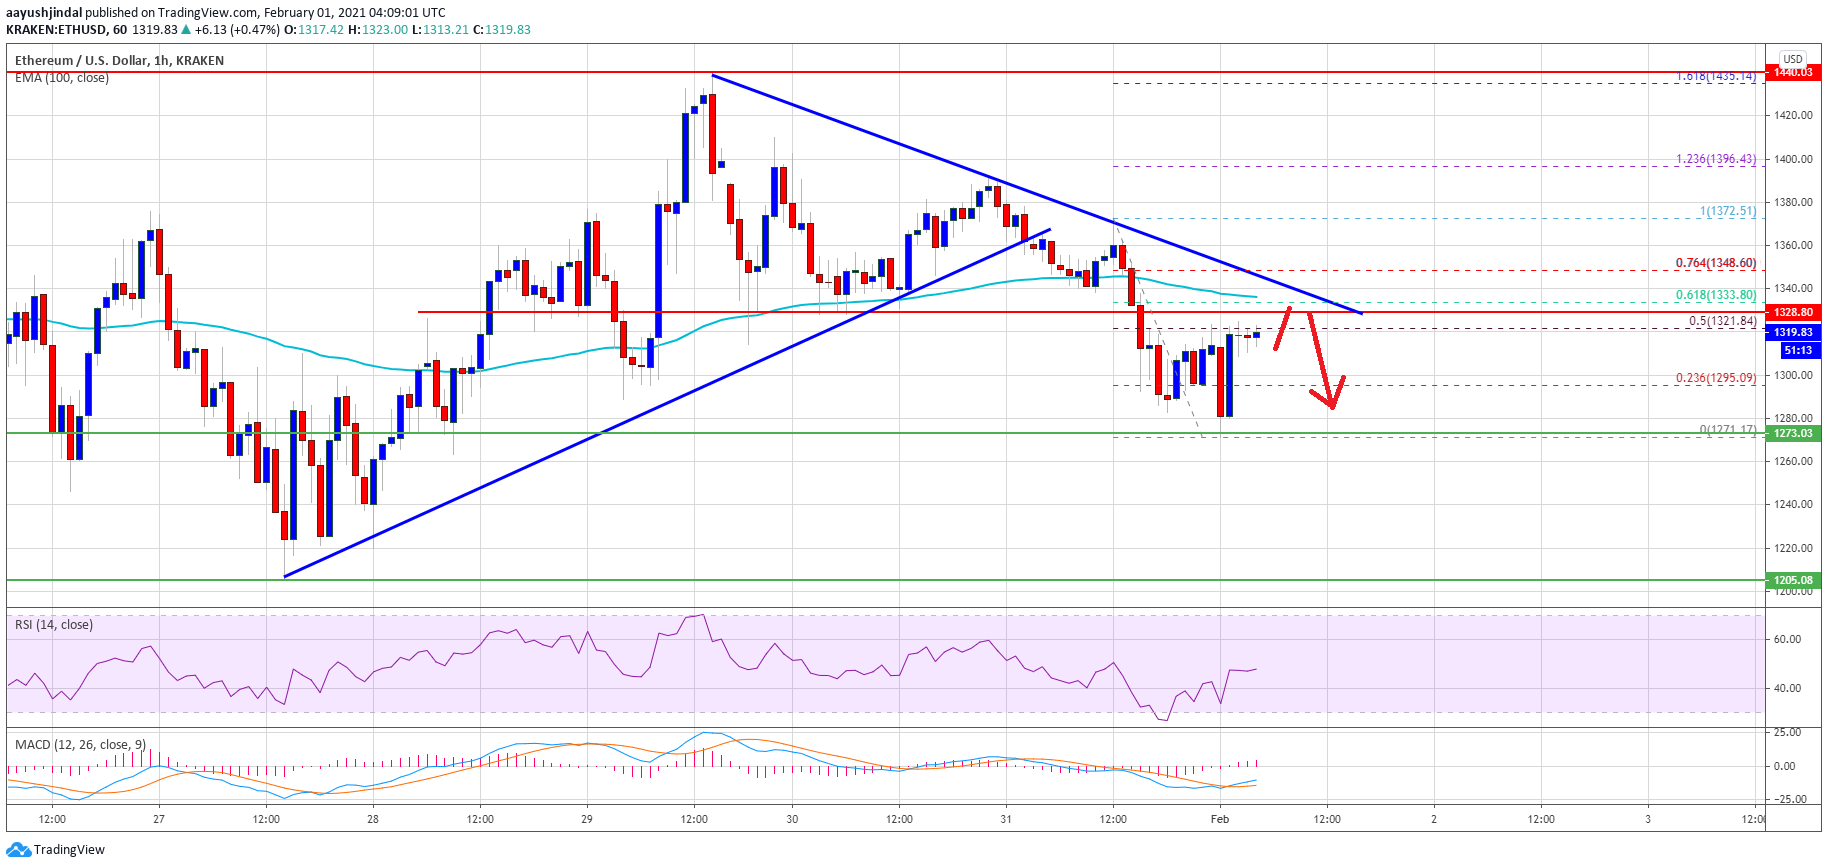
However, the bulls were able to protect the $ 1,275 support. A low is being formed near $ 1,274 and the price is currently correcting higher. It tests the $ 1,320 resistance level, which is close to the 50% fib retracement level of the recent decline from the high of $ 1,375 to the low of $ 1,274.
The first major resistance is near the USD 1,340 and USD 1,350 levels. An important bearish trendline is also forming on the hourly chart of ETH / USD with resistance near USD 1,345. The trendline is close to the 61.8% Fib retracement level of the recent decline from the high of $ 1,375 to the low of $ 1,274.
Source: ETHUSD on TradingView.com
Additionally, the 100-hour SMA is positioned near $ 1,340 to act as a hurdle. A sharp break above the $ 1,340 and $ 1,350 resistance levels could potentially open the doors for a bigger hike in the upcoming sessions. In the given case, there is a high probability of a break above the $ 1,400 resistance level.
Fresh bath at ETH?
If Ethereum fails to break the USD 1,340 zone and the trendline resistance, it could see another decline. Initial downside support is near the $ 1,300 level.
The first major support is near the USD 1,275 zone. Unless the ether price stays above the USD 1,275 support, there is a risk of falling towards the USD 1,200 support zone.
Technical indicators
Hourly MACD – – The MACD for ETH / USD is slowly gaining pace in the bullish zone.
Hourly RSI – – The RSI for ETH / USD is currently approaching the 50 level.
Main support tier – $ 1,275
Main Resistance Level – $ 1,350
