Ethereum is facing strong resistance near $ 1,800 against the US dollar. The ETH price must be above $ 1,800 and the 100 hour SMA to get into a bullish zone.
- Ethereum traded towards the $ 1,710 support before correcting higher.
- The price is now facing strong resistance near $ 1,800 and the 100-hour simple moving average.
- An important bearish trendline is forming on the hourly chart of ETH / USD (data feed via Kraken) with resistance near USD 1,800.
- The pair could see a steady rise if it levels above $ 1,800 and the 100-hour SMA.
The Ethereum price is facing hurdles
Ethereum declined towards the USD 1,700 support zone where the bulls surfaced. ETH was trading as low as $ 1,712 before embarking on an upward correction, similar to Bitcoin.
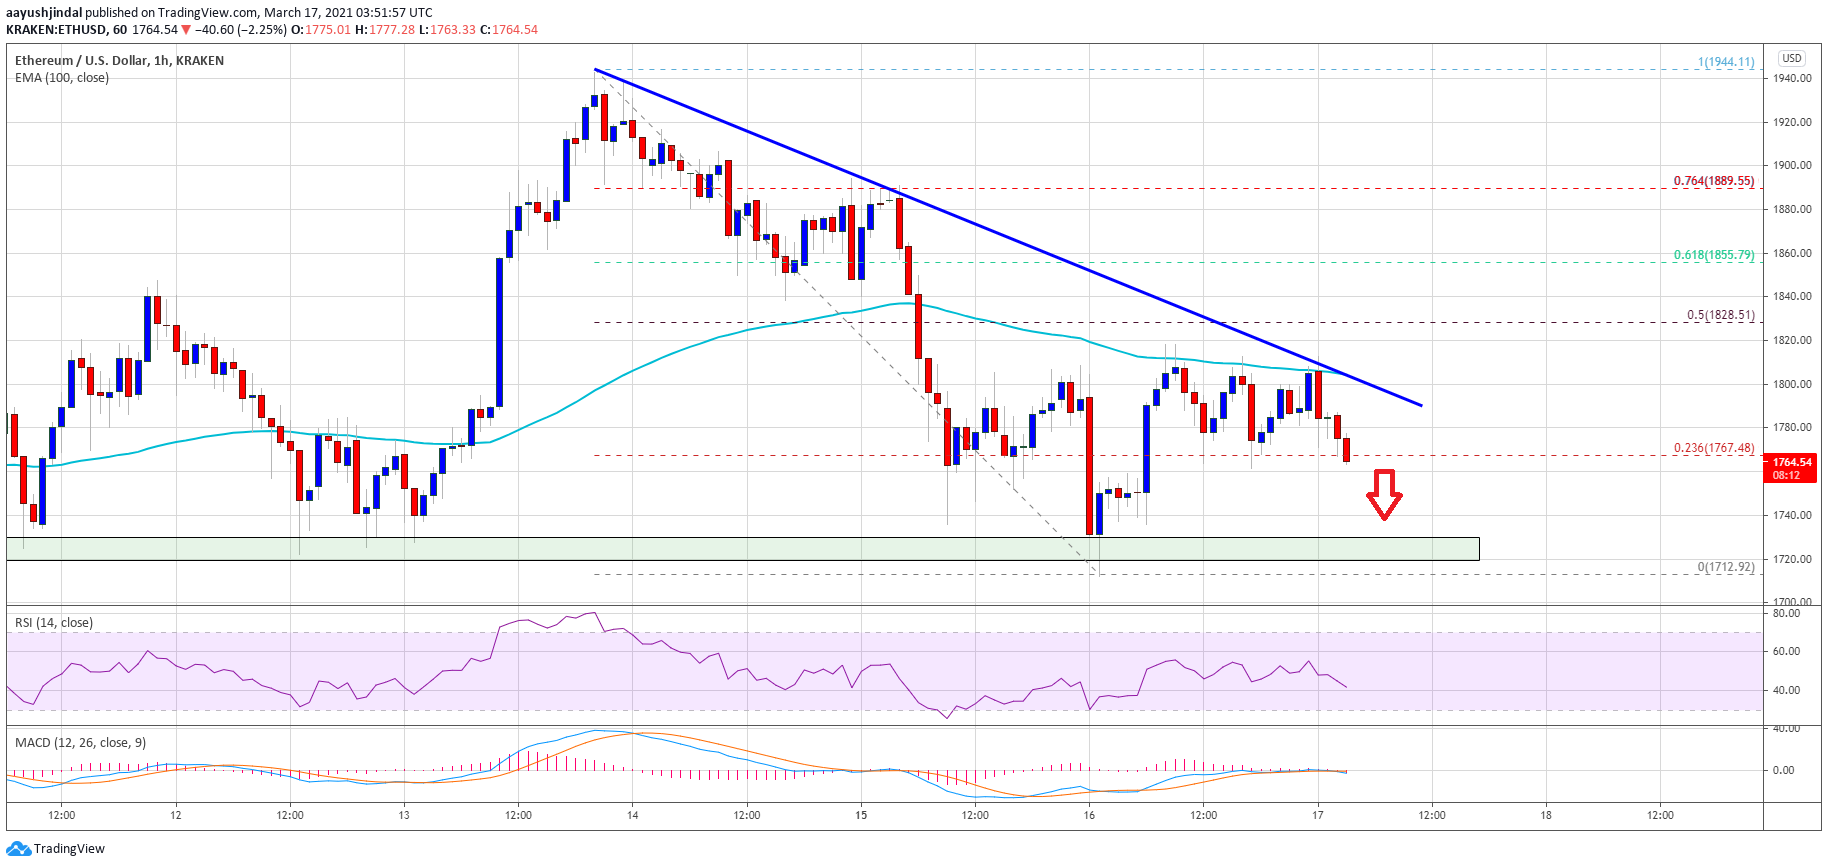
The price was above the $ 1,750 and $ 1,760 resistance levels. There was a break above the 23.6% fib retracement level of the bearish wave from the high of $ 1,944 to the low of $ 1,712. However, the price appears to face strong resistance near the $ 1,800 level.
An important bearish trendline is also forming on the hourly chart of ETH / USD with resistance near USD 1,800. Trendline resistance at $ 1,800 is also close to the 100-hour simple moving average.
Source: ETHUSD on TradingView.com
A sharp break above the trendline resistance could open the doors for a steady rise above $ 1,800. Immediate resistance is at $ 1,828. It is close to the 50% Fib retracement level of the bearish wave from the high of $ 1,944 to the low of $ 1,712.
The next major resistance is near the $ 1,855 level, above which the ether price could steadily rise towards the $ 1,900 and $ 1,920 levels in the near future.
New decline in ETH?
Unless Ethereum corrects higher than the $ 1,800 and $ 1,828 resistance levels, it could continue to decline. The first major support is near the $ 1,710 level.
The main support appears to be forming near the $ 1,700 level. If the bulls fail to defend the $ 1,700 support zone, there is a risk of falling to the $ 1,660 level. Further losses could potentially push the price down to the $ 1,620 level.
Technical indicators
Hourly MACD – – The MACD for ETH / USD is slowly gaining pace in the bearish zone.
Hourly RSI – – The RSI for ETH / USD is still below the 50 level.
Main support tier – $ 1,700
Main Resistance Level – $ 1,800
