Polkadots DOT corrected lower from $ 42.00 but remained stable above $ 30.00 against the US dollar. It is rising now and it seems like the bulls are aiming for a fresh move to $ 40.00 and $ 42.00.
- DOT holds the floor above the $ 30.00 and $ 35.00 levels against the US Dollar.
- The price is trading well above the USD 35.00 support and the simple moving average of 100 (4 hours).
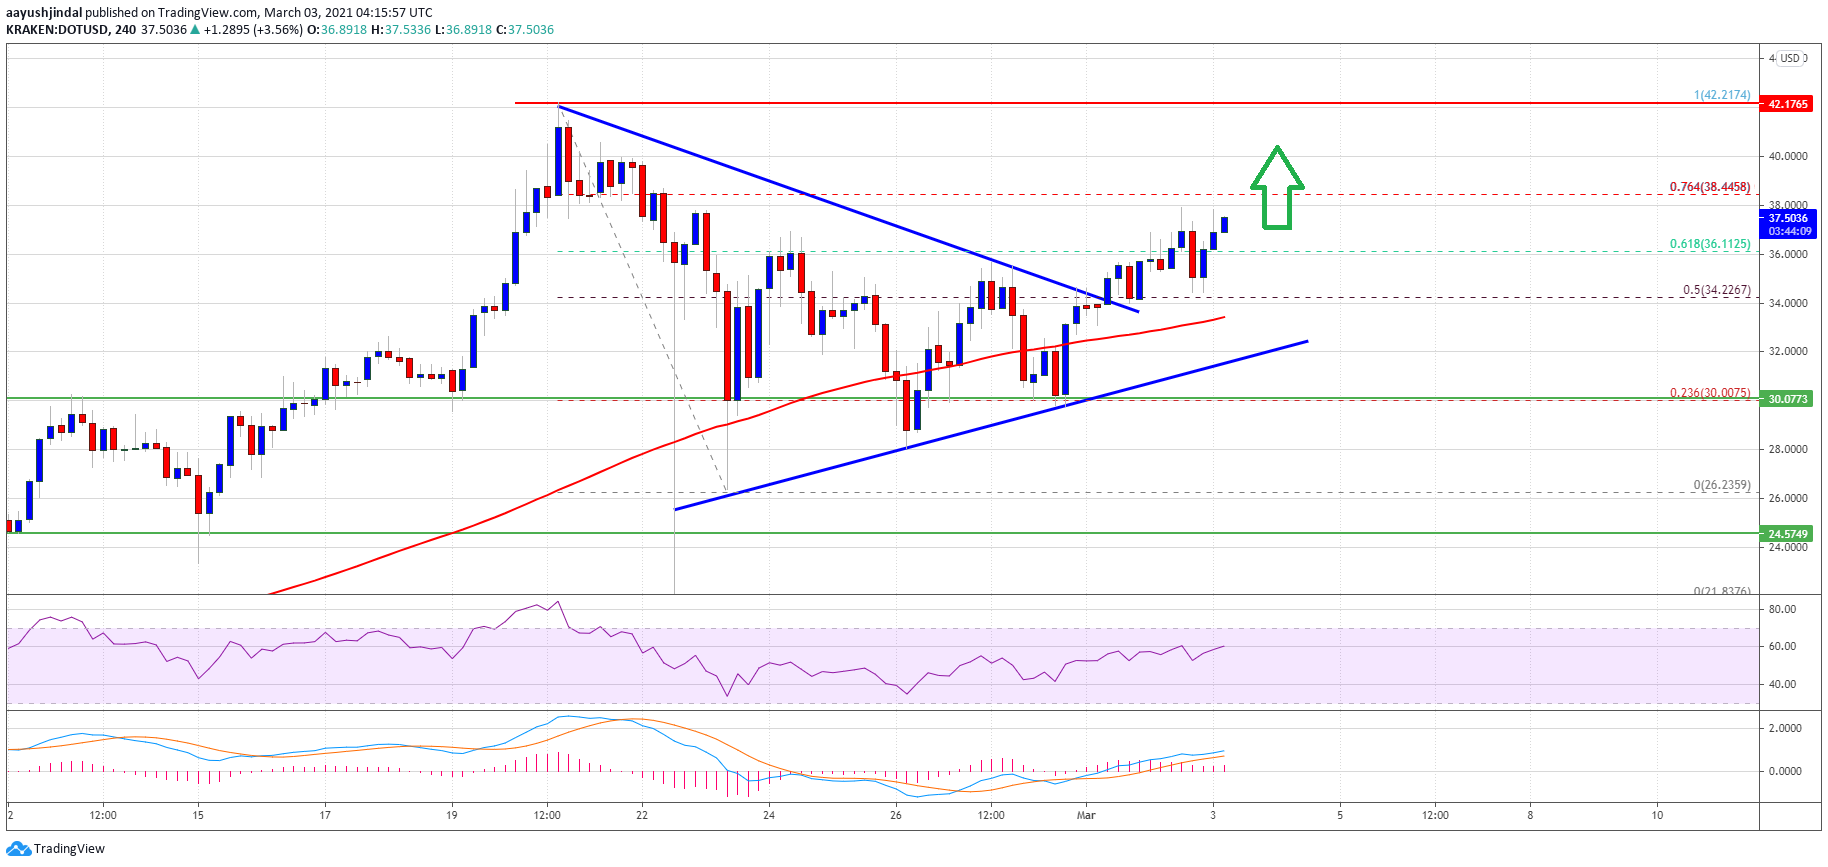
- The 4-hour chart for the DOT / USD pair (data source from Kraken) broke above a key bearish trendline with resistance near USD 34.50.
- The pair is still in a strong uptrend and could hit $ 40.00 and $ 42.00 again soon.
Polkadots DOT Eyes Fresh Rally
After finding strong bids near $ 42.00, DOT began a downward correction. There was a pause below the $ 35.00 and $ 32.00 support levels. The price even fell below the $ 30.00 support level, but the bulls stayed in action.
A swing low was formed near $ 26.25 before the price rose again. The price rose above the $ 30.00 and $ 32.00 resistance levels. There was a break above the 50% Fib retracement level of the downward move from the $ 42.20 swing high to the $ 26.25 swing low.
Source: DOTUSD on TradingView.com
There was also a break above a key bearish trendline with resistance near $ 34.50 on the 4-hour chart for the DOT / USD pair. It is now trading well above the USD 35.00 support and the simple moving average of 100 (4 hours).
Immediate resistance is near the $ 38.50 level. It is close to the 76.4% Fib retracement level of the downward move from the $ 42.20 swing high to the $ 26.25 swing low. A sharp break above the $ 38.50 and $ 38.80 resistance levels could move the price towards the $ 40.00 level. The next key resistance is near the $ 42.00 level.
Dips supported?
If the DOT price stops rising above $ 38.50 or $ 39.00, there may be a short-term downward correction. The first major support is near the USD 36.00 and USD 35.00 levels.
The next big support is near the $ 33.50 level and the simple moving average of 100 (4 hours). Further losses could potentially open the doors for a move towards the USD 30.00 support zone.
Technical indicators
4 Hour MACD – The MACD for DOT / USD is gaining momentum in the bullish zone.
4-hour RSI (Relative Strength Index) – The RSI for DOT / USD is now above the 50 level.
Major Support Levels – $ 36.00, $ 35.00, and $ 33.50.
Main Resistance Levels – $ 38.50, $ 40.00, and $ 42.00.
