Ripple corrected gains well over $ 0.5000 against the US dollar. XRP price holds key support at $ 0.3400 and is likely to climb back towards $ 0.4200 and $ 0.4400.
- Ripple started a new drop after failing to remove the $ 0.5500 resistance against the US dollar.
- The price is still holding the $ 0.3400 support zone and the 100-day simple moving average.
- A large bearish trendline is forming on the daily chart of the XRP / USD pair (data source from Kraken) with resistance near USD 0.4650.
- The pair is rising towards the $ 0.4500 and $ 0.4650 resistance levels again in the short term.
Ripple’s XRP price could rise again
After a significant hiatus above $ 0.3200, Ripple’s XRP price soared. There was a significant break above the USD 0.4000 resistance zone and the USD 0.5000 level.
The price even surged above $ 0.5200 and was above the 100-day simple moving average. However, the bulls were unable to clear the $ 0.5500 resistance area. A high was formed near $ 0.5343 before a new decline began.
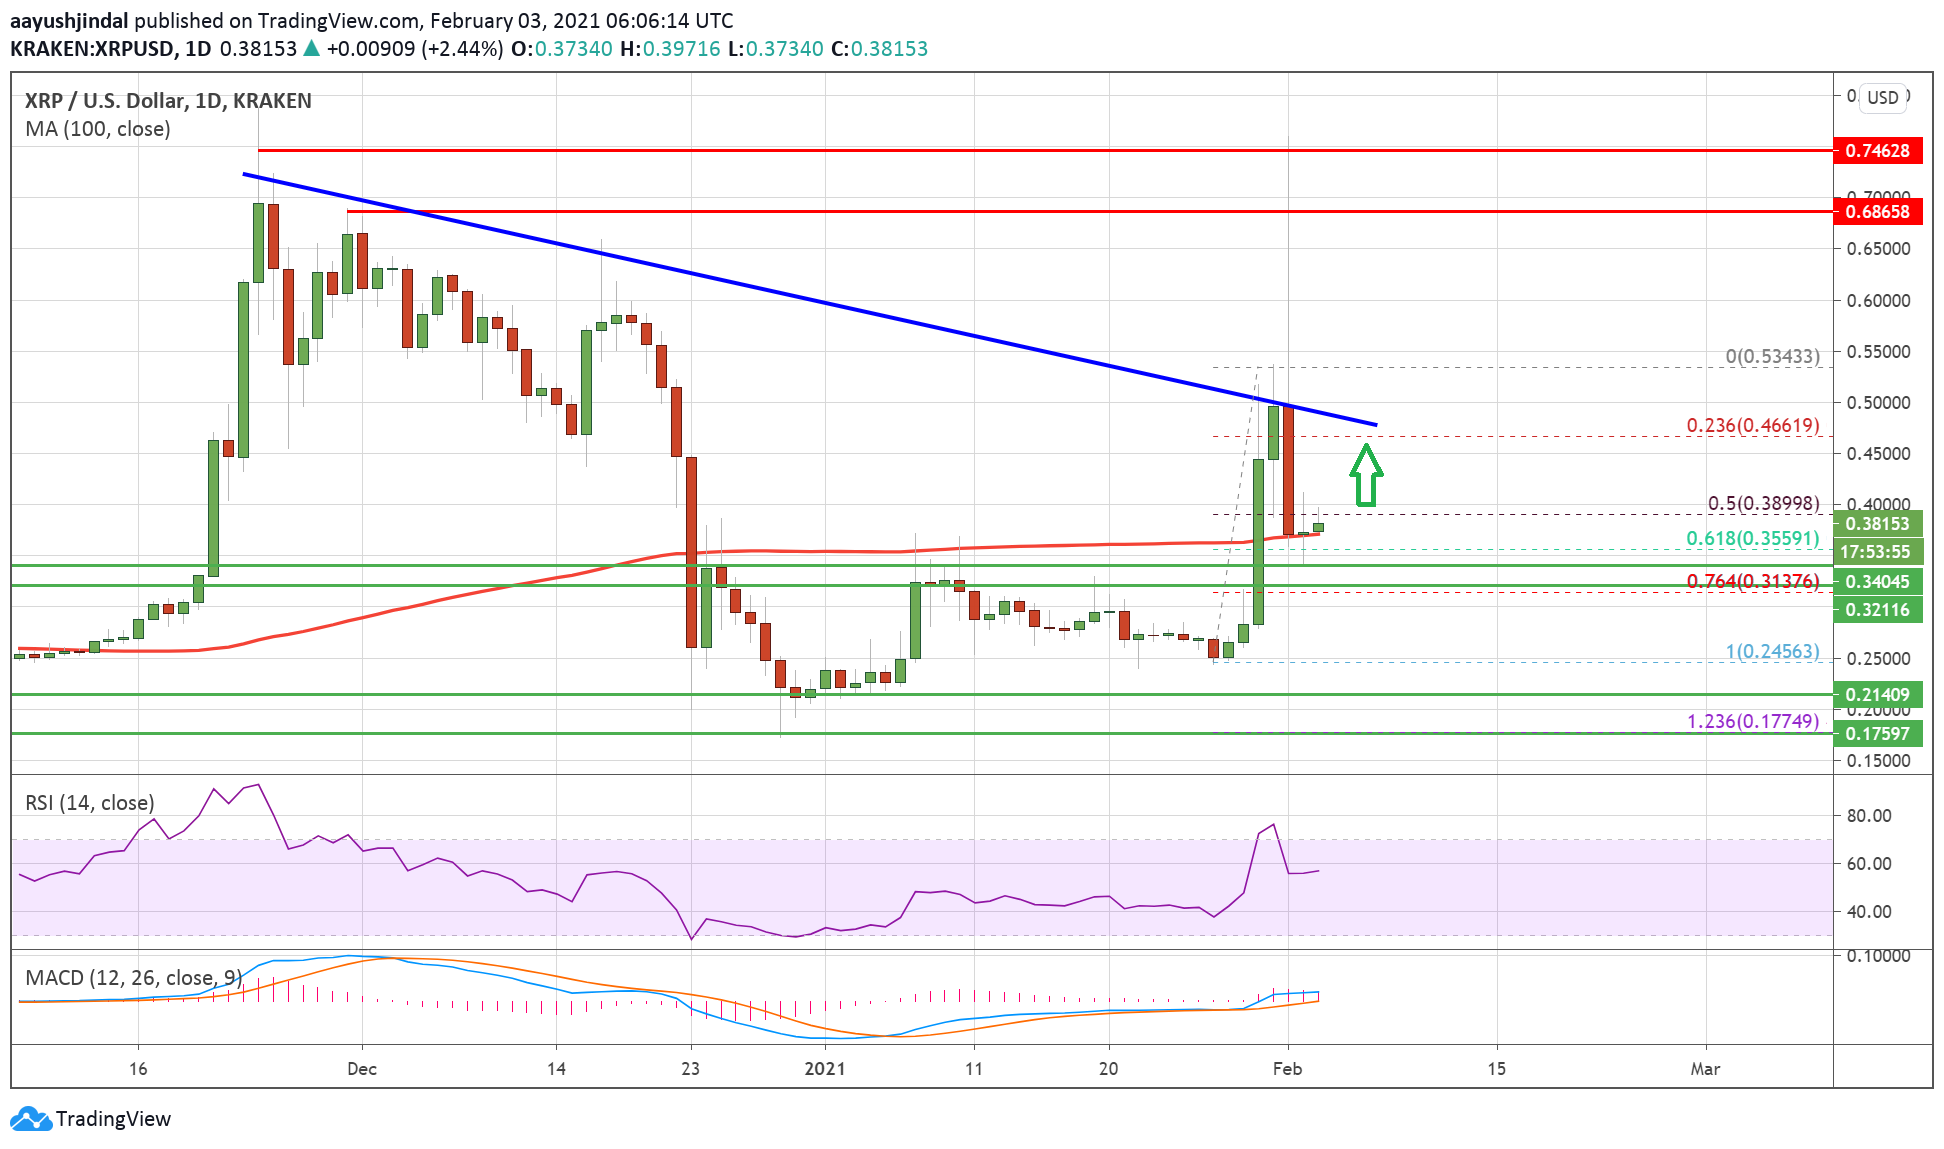
There was a pause below the $ 0.4200 and $ 0.4000 support levels. The price even fell below the 50% Fib retracement level of the move up from the low of $ 0.2456 to the high of $ 0.5343. The price is still holding the $ 0.3400 support zone and the 100-day simple moving average.
Source: XRPUSD on TradingView.com
The 61.8% Fib retracement level of the move up from the low of $ 0.2456 to the high of $ 0.5343 also acts as support. On the upside, the price is facing hurdles near $ 0.4000. A large bearish trendline is also forming on the daily chart of the XRP / USD pair with resistance near USD 0.4650.
It seems like the price is likely to hit the $ 0.4400 and $ 0.4500 resistance levels again as long as there is no break below the $ 0.3200.
Downsides Limited in XRP?
If the ripple doesn’t trigger a decent spike, it could find support near $ 0.3680 and $ 0.3600. The first major support is near the $ 0.3550 level.
The main support could be near the USD 0.3200 level. If the price does not stay above $ 0.3200, there could be a downward extension towards the $ 0.2450 support zone.
Technical indicators
Daily MACD – The MACD for XRP / USD is slowly gaining momentum in the bullish zone.
Daily RSI (Relative Strength Index) – The RSI for XRP / USD is still above the 50 level.
Major support levels – $ 0.3650, $ 0.3550, and $ 0.3200.
Main Resistance Levels – $ 0.4000, $ 0.4400, and $ 0.4500.
