Ripple started a sharp decline after breaking the $ 0.5300 support against the US dollar. The XRP price is now trading well below $ 0.5000 and could continue falling towards $ 0.4200.
- Ripple began a sharp decline from well above the USD 0.5300 support zone against the US dollar.
- The price is now trading well below $ 0.5000 and the simple moving average of 100 (4 hours).
- On the 4-hour chart for the XRP / USD pair (data source from Kraken) there was a break beneath a heavily bearish channel with support near USD 0.5400.
- The pair is gaining bearish momentum and could continue moving towards $ 0.4300 or $ 0.4200.
Ripple’s XRP price is gaining bearish momentum
After rising sharply towards $ 0.6500, Ripple’s XRP price began to decline steadily. The price was below the $ 0.6000 and $ 0.5500 support levels. There has recently been a sharp drop in Bitcoin and Ethereum, which has resulted in further losses in XRP.
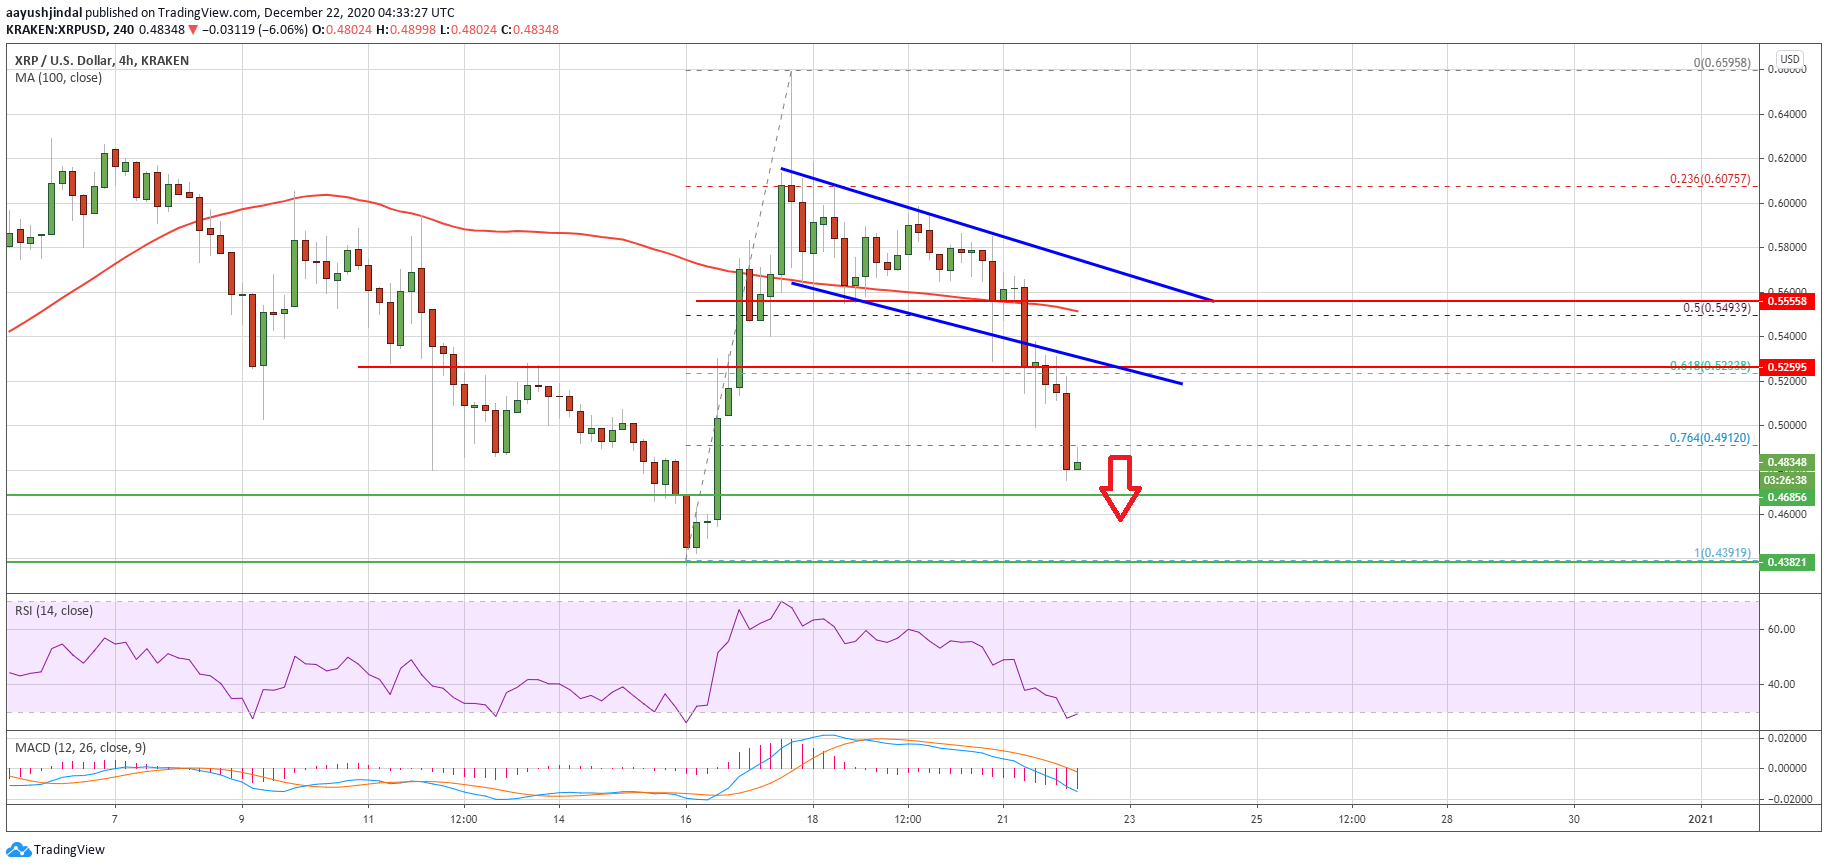
There was a key downside break below the USD 0.5300 support level and the 100 simple moving average (4 hours). There was also a break under a heavily bearish channel with support near $ 0.5400 on the 4-hour chart for the XRP / USD pair.
Source: XRPUSD on TradingView.com
The pair was below the $ 0.5000 support level and trading below the 50% fib retracement level of the uptrend of the key from the low of $ 0.4391 to the high of $ 0.6585.
It opened the doors to further losses below $ 0.4800. XRP price is now trading below the 76.4% fib retracement level of the key uptrend from the low of $ 0.4391 to $ 0.6585. Further losses could lead the price towards $ 0.4500. The next big support is near the $ 0.4300 level, below which the price could test as much as $ 0.4200.
Limited upsides in XRP?
If the ripple triggers a recovery wave, it could face many hurdles starting at $ 0.5000. The first major resistance for the bulls is near the $ 0.5250 and $ 0.5300 levels (the most recent breakdown zone).
The main resistance is now forming near the USD 0.5500 level and the 100 simple moving average (4 hours). A close above the $ 0.5300 and $ 0.5500 levels could trigger a new rally towards the $ 0.6500 zone.
Technical indicators
4 Hour MACD – The MACD for XRP / USD is gaining momentum in the bearish zone.
4-hour RSI (Relative Strength Index) – The RSI for XRP / USD is now well below the 50 level.
Major support levels – $ 0.4500, $ 0.4300, and $ 0.4200.
Main Resistance Levels – $ 0.5000, $ 0.5300, and $ 0.5500.
