Ripple didn’t stay above $ 0.5550 and fell over 10% against the US dollar. XRP price could go lower if it doesn’t stay above 100 SMA (H4) and $ 0.4850.
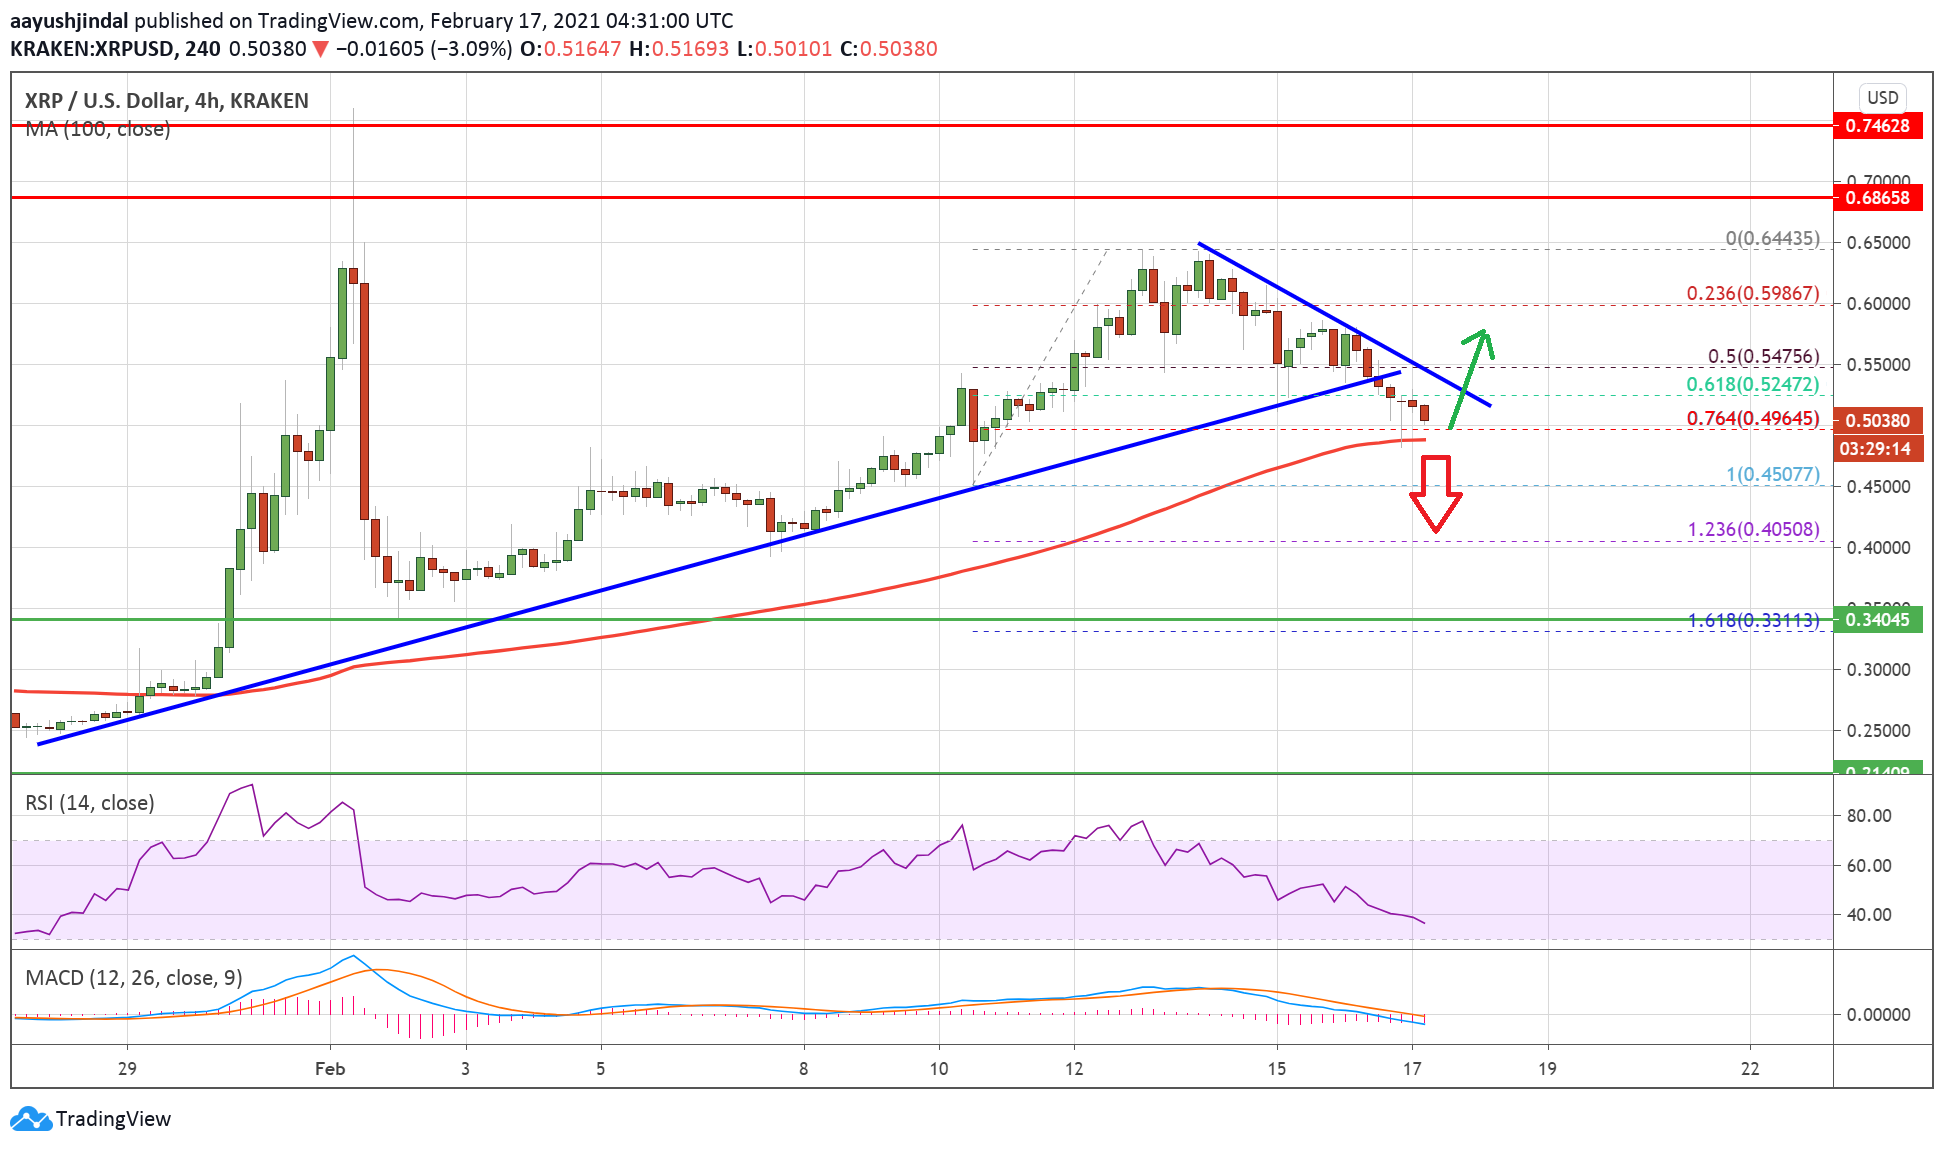
- Ripple started a new drop after struggling to break the $ 0.6500 resistance against the US dollar.
- The price is now trading well below $ 0.5500 and testing the 100 simple moving average (4 hours).
- The 4-hour chart of the XRP / USD pair (data source from Kraken) broke below a major bullish trendline with support near USD 0.5300.
- The pair could either continue to drop below $ 0.4800 or start a fresh move from 100 SMA (H4).
Ripple’s XRP price tests key support
After closing above the $ 0.5000 level, Ripple’s XRP price rose steadily. The price solved the $ 0.5500 and $ 0.5720 resistance levels. It even surpassed the $ 0.6000 level and was well above the simple moving average of 100 (4 hours).
It hit near the $ 0.6445 level and recently started a new decline. There was a pause below the $ 0.6000 and $ 0.5800 support levels. The price traded below the 50% fib retracement level of the move up from the low of $ 0.4507 to the high of $ 0.6443.
There was also a break below a major bullish trendline with support near $ 0.5300 on the 4-hour chart for the XRP / USD pair. The pair is now trading well below $ 0.5500 and testing the 100 simple moving average (4 hours).
Source: XRPUSD on TradingView.com
It also tests the 76.4% Fib retracement level of the move up from the low of $ 0.4507 to the high of $ 0.6443. If the downward move breaks below the USD 0.4850 support and the 100 SMA, there is a risk of a sharp decline.
The next big support is near the $ 0.4500 level. Further losses could potentially open the doors for a move towards the USD 0.4000 support level.
Fresh surge in XRP?
If the ripple stays above the USD 0.4850 support and the 100 SMA, there is a possibility of rising again. Initial resistance is near the USD 0.5250 level and a connecting bearish trendline.
A sharp break above the trendline resistance could push the price above $ 0.5500. The next major resistance for the bulls could be $ 0.6000.
Technical indicators
4 Hour MACD – The MACD for XRP / USD is picking up pace in the bearish zone.
4-hour RSI (Relative Strength Index) – The RSI for XRP / USD is now well below the 50 level.
Major support levels – $ 0.4850, $ 0.4500, and $ 0.4000.
Main Resistance Levels – $ 0.5250, $ 0.5500, and $ 0.6000.
