Bitcoin price started a new upward movement from the $ 44,000 zone against the US dollar. BTC hit a new all-time high near $ 48,680 and should continue to climb towards $ 50,000.
- Bitcoin is showing many positive signs above the $ 46,000 and $ 47,500 resistance levels.
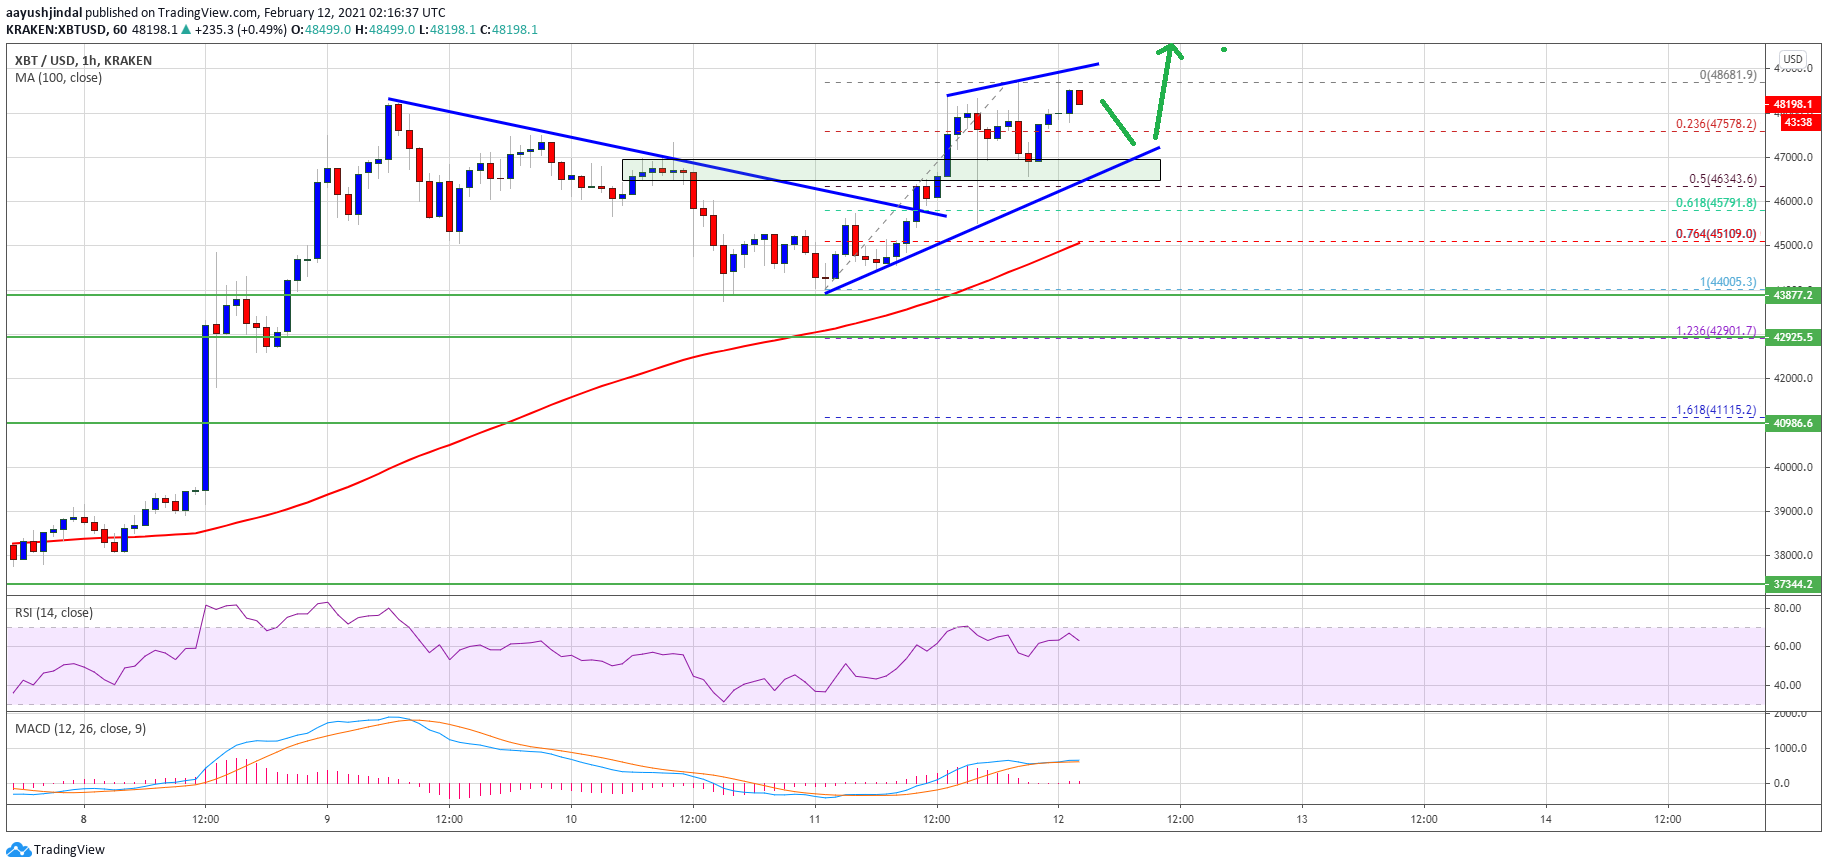
- The price is trading above the $ 48,000 resistance and the 100 hour simple moving average.
- A major triangle pattern is forming on the hourly chart of the BTC / USD pair (data feed from Kraken) with support near USD 47,000.
- The pair is likely to continue rising towards $ 50,000 as long as it is above $ 47,000.
Bitcoin price has more advantages in mind
After a correction towards USD 44,000, Bitcoin price started a new uptrend. BTC broke the $ 46,000 resistance level and remained stable above the 100-hour simple moving average.
As a result, the bulls were able to push the price above the $ 47,000 and $ 47,500 resistance levels. The price is now trading well above USD 48,000 and has even reached a new all-time high of USD 48,680. It is now consolidating profits above the $ 48,000 level.
Initial support is near the USD 47,570 level. It is close to the recent wave of the Fib retracement level of 23.6% from the low of $ 44,005 to the high of $ 48,680. A major triangle pattern is also forming on the hourly chart of the BTC / USD pair, forming with support near USD 47,000.
The triangle support is close to the recent wave of the Fib retracement level of 50% from the low of $ 44,005 to the high of $ 48,680. On the upside, the $ 48,500 region is a short-term resistance. The next major resistance could be near the $ 49,400 level. The general price movement suggests that bitcoin bulls could aim for a test of $ 50,000 in the short term.
Dips Limited in BTC?
If Bitcoin doesn’t stay higher, it can correct below the $ 47,500 level. The first major support is near the USD 47,000 level and the lower trendline of the triangle.
The main support is now forming near the $ 45,000 level or the 100 hour simple moving average. Further losses could open the doors for a dip below the $ 44,000 support in the short term.
Technical indicators:
Hourly MACD – The MACD is slowly gaining momentum in the bullish zone.
Hourly RSI (Relative Strength Index) – The RSI for BTC / USD is now above the 50 level.
Major Support Levels – $ 47,000, followed by $ 45,000.
Main Resistance Levels – $ 48,500, $ 49,400, and $ 50,000.
