Bitcoin price rebounded towards the $ 38,000 resistance but failed to hold gains against the US dollar. BTC started a new decline and is now struggling to stay above $ 33,500.
- Bitcoin is showing some bearish signs below the $ 35,000 and $ 35,500 resistance levels.
- The price is now trading near the pivot level of $ 34,000 and the simple moving average of 100 (4 hours).
- A major bullish trendline is forming on the 4-hour chart of the BTC / USD pair (data feed from Kraken) with support near USD 33,900.
- The pair is either plummeting towards $ 31,000 or it could unlock $ 35,000 for a fresh move.
Bitcoin price remains at risk
For the past week, Bitcoin price surged well above the $ 35,000 resistance against the US dollar. The BTC / USD pair rose over 15% and even surged above the $ 36,500 level.
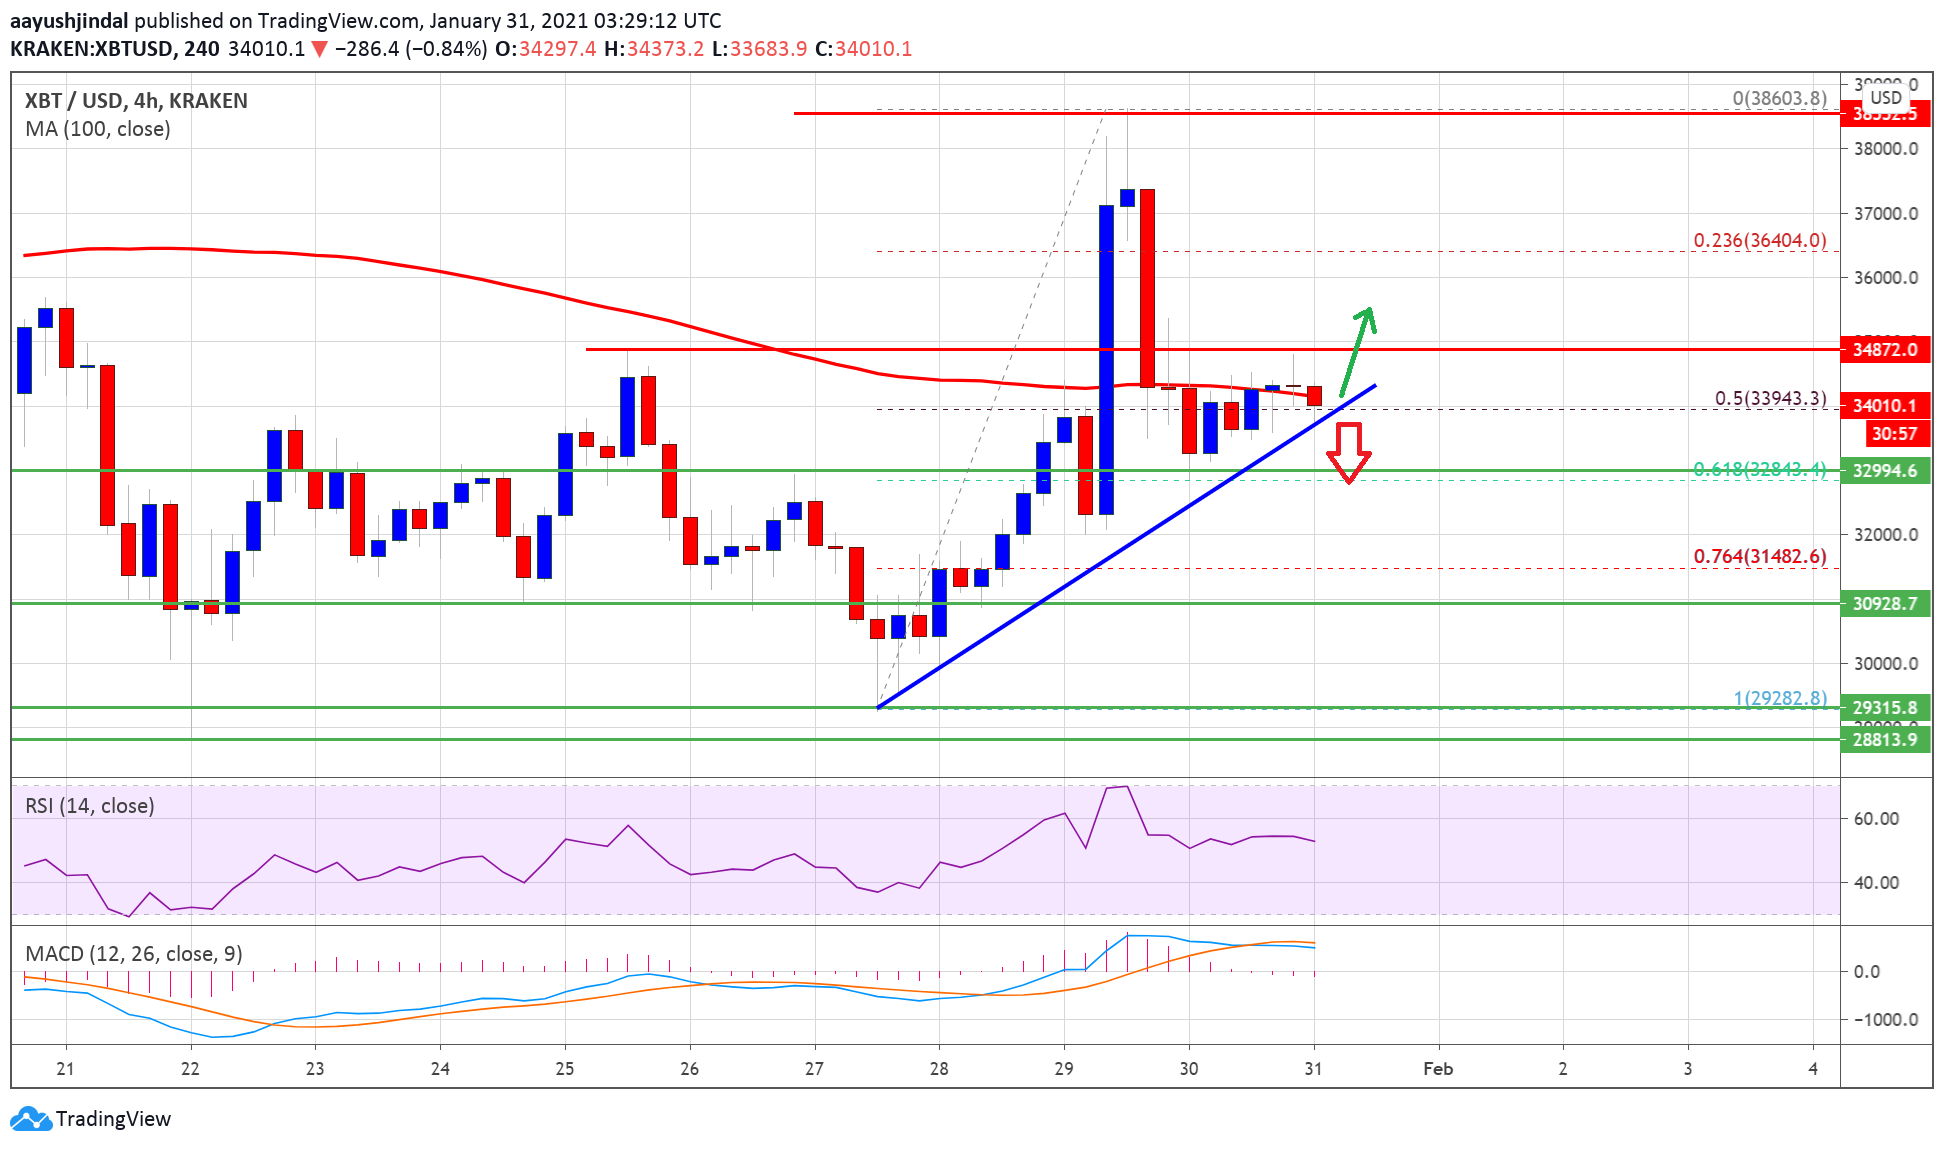
The price rose above the $ 38,000 resistance and was above the simple moving average of 100 (4 hours). A high was formed near $ 38,603 before the price fell again. There was a sharp drop below the $ 36,500 and $ 36,000 levels.
Bitcoin price even traded below the 50% fib retracement level of the uptrend from $ 29,282 low to $ 38,603. The price even tested the support level of $ 33,000.
It found support near the 61.8% fib retracement level of the move up from the $ 29,282 low to the $ 38,603 high. The price is now trading near the pivot level of $ 34,000 and the simple moving average of 100 (4 hours).
A major bullish trendline is also forming on the 4-hour chart of the BTC / USD pair with support near USD 33,900. If the trendline breaks significantly, the price could drop further below $ 33,500. The next major support is at $ 33,000. Further losses could move the price towards the USD 31,000 support zone.
New rise in BTC?
If Bitcoin stays above trendline support, there is a chance it could climb back above $ 34,500. Initial resistance to the upside is near the $ 35,000 level.
A reasonable pause and a close above the USD 35,000 resistance will most likely set the pace for sustained upward movement in the upcoming sessions. The next major resistance to the upside is near the $ 36,400 level.
Technical indicators
4 hours MACD – The MACD for BTC / USD is slowly gaining momentum in the bearish zone.
4 hour RSI (Relative Strength Index) – The RSI for BTC / USD is just above the 50 level.
Main support tier – $ 33,500
Main Resistance Level – $ 35,000
