Bitcoin price surged above the $ 0,000 level before initiating a downward correction against the US dollar. BTC is currently testing a large support at $ 38,600, below which it could drop to $ 36,000.
- Bitcoin climbed above the $ 38,000 resistance but struggled to stay above $ 40,000.
- The price is trading near the $ 38,600 support but is well above the 100 simple moving average (4 hours).
- A major bullish trendline is forming on the 4-hour chart of the BTC / USD pair (data feed from Kraken) with support near USD 38,650.
- The pair could either fall sharply towards $ 36,000 or rise back above $ 40,000.
Bitcoin price remains at risk
For the past week, Bitcoin price surged well above the USD 36,000 resistance against the US dollar. The BTC / USD pair even climbed above the USD 38,000 resistance to move further into a positive zone.
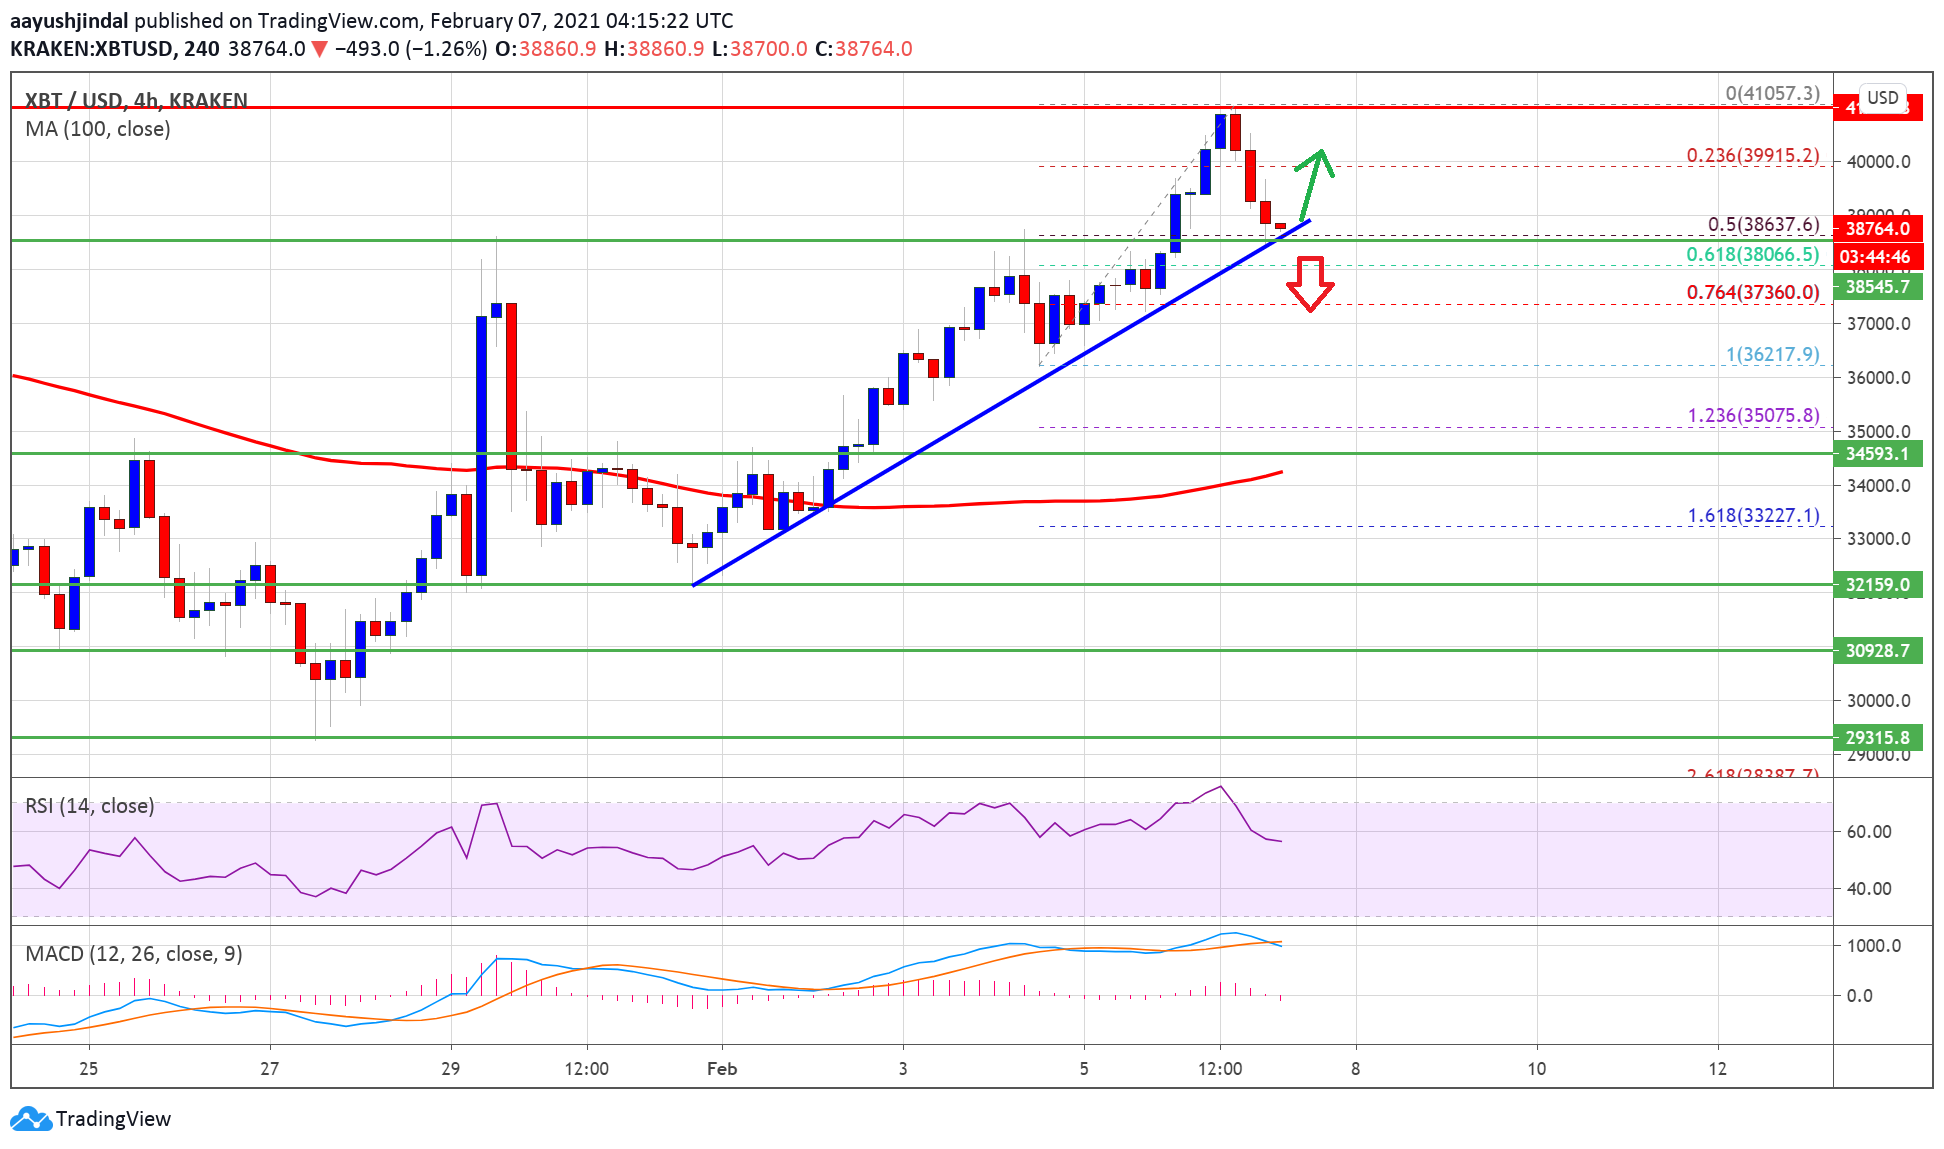
The price broke the USD 40,000 resistance and was above the simple moving average of 100 (4 hours). A high was formed near $ 41,050 before the price began a downward correction. There was a pause below the $ 39,500 and $ 39,000 levels.
The price even traded below the 23.6% Fib retracement level of the uptrend from the low of $ 36,217 to the high of $ 41,050. Bitcoin is now trading near the USD 38,600 support level.
Source: BTCUSD on TradingView.com
A major bullish trendline is also forming on the 4-hour chart of the BTC / USD pair with support near USD 38,650. The 50% fib retracement level of the move up from the low of $ 36,217 to the high of $ 41,050 is also near the trendline to provide support.
A downside break below trendline support could open the doors to a larger drop below $ 37,000. The next big support is near the $ 36,000 level.
New rise in BTC?
If Bitcoin stays above trendline support, there is a chance it could climb back above $ 39,500. Initial resistance to the upside is near the $ 40,000 level.
A reasonable pause and a close above the USD 40,000 resistance will most likely set the pace for sustained upward movement in the upcoming sessions. The next major resistance to the upside is near the $ 41,500 level.
Technical indicators
4 hours MACD – The MACD for BTC / USD is slowly gaining momentum in the bearish zone.
4 hour RSI (Relative Strength Index) – The RSI for BTC / USD is still above the 50 level.
Main Support Tier – $ 38,600
Main Resistance Level – $ 40,000
