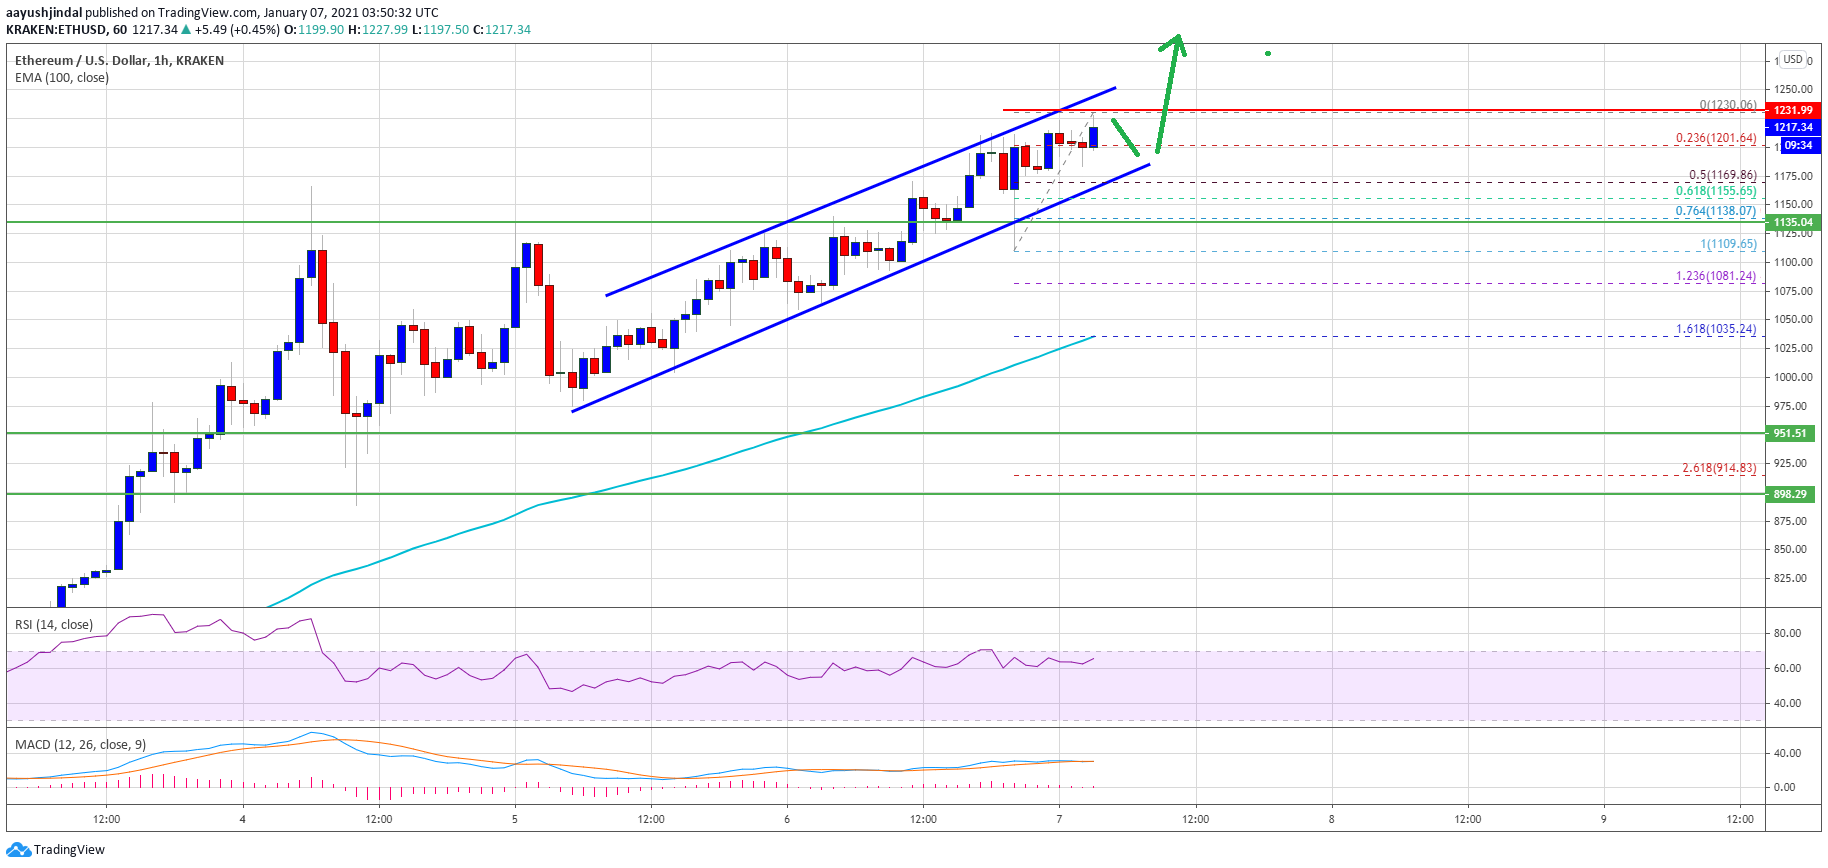
Ethereum has extended its surge above the USD 1,150 and USD 1,200 resistance levels against the US dollar. ETH price is currently consolidating gains and could continue to climb towards $ 1,280.
- Ethereum is following a bullish path above the USD 1,120 and USD 1,150 resistance levels.
- The price is now above $ 1,200 and the 100 hour simple moving average.
- A major rising channel is forming on the hourly chart of ETH / USD (data feed via Kraken) with support near USD 1,180.
- The pair should continue to rise if it stays stable above $ 1,180 and $ 1,150.
Ethereum price rises by 12%
After Ethereum established a support base above $ 1,100, it started a new boost. ETH price broke the USD 1,120 and USD 1,150 resistance levels to move further into a positive zone.
There was also a break above the $ 1,200 level and a close above the 100 hour average. Ether price hit a new multi-month high near $ 1,230 and is currently consolidating gains. Initial downside support is near the USD 1,200 level.
It is close to the 23.6% Fib retracement level of the move up from the low of $ 1,109 to the high of $ 1,230. A major rising channel is also forming on the hourly chart of ETH / USD with support near USD 1,180.
Channel support is close to the 50% fib retracement level of the move up from the low of $ 1,109 to the high of $ 1,230. On the upside, the $ 1,230 level is a bit of resistance. A significant break above the $ 1,230 level could open the doors to a bigger spike (similar to Bitcoin).
In the given case, the price could fall slightly above the $ 1,250 level. The next key stop could be at $ 1,300, above which the $ 1,320 level could be tested above in the short term.
Dips Limited at ETH?
If Ethereum fails to hit the $ 1,230 and $ 1,250 resistance levels, it could initiate a short-term downward correction. Initial downside support is near channel support and at $ 1,180.
A downside break below the channel support trendline could lead ether price towards multi-touch zone 9a ($ 1,125). Further losses could require testing the 100-hour SMA at $ 1,035 in the upcoming sessions.
Technical indicators
Hourly MACD – – The MACD for ETH / USD is losing pace in the bullish zone.
Hourly RSI – – The RSI for ETH / USD is currently well above the 60 level.
Main support tier – $ 1,180
Main Resistance Level – $ 1,230
