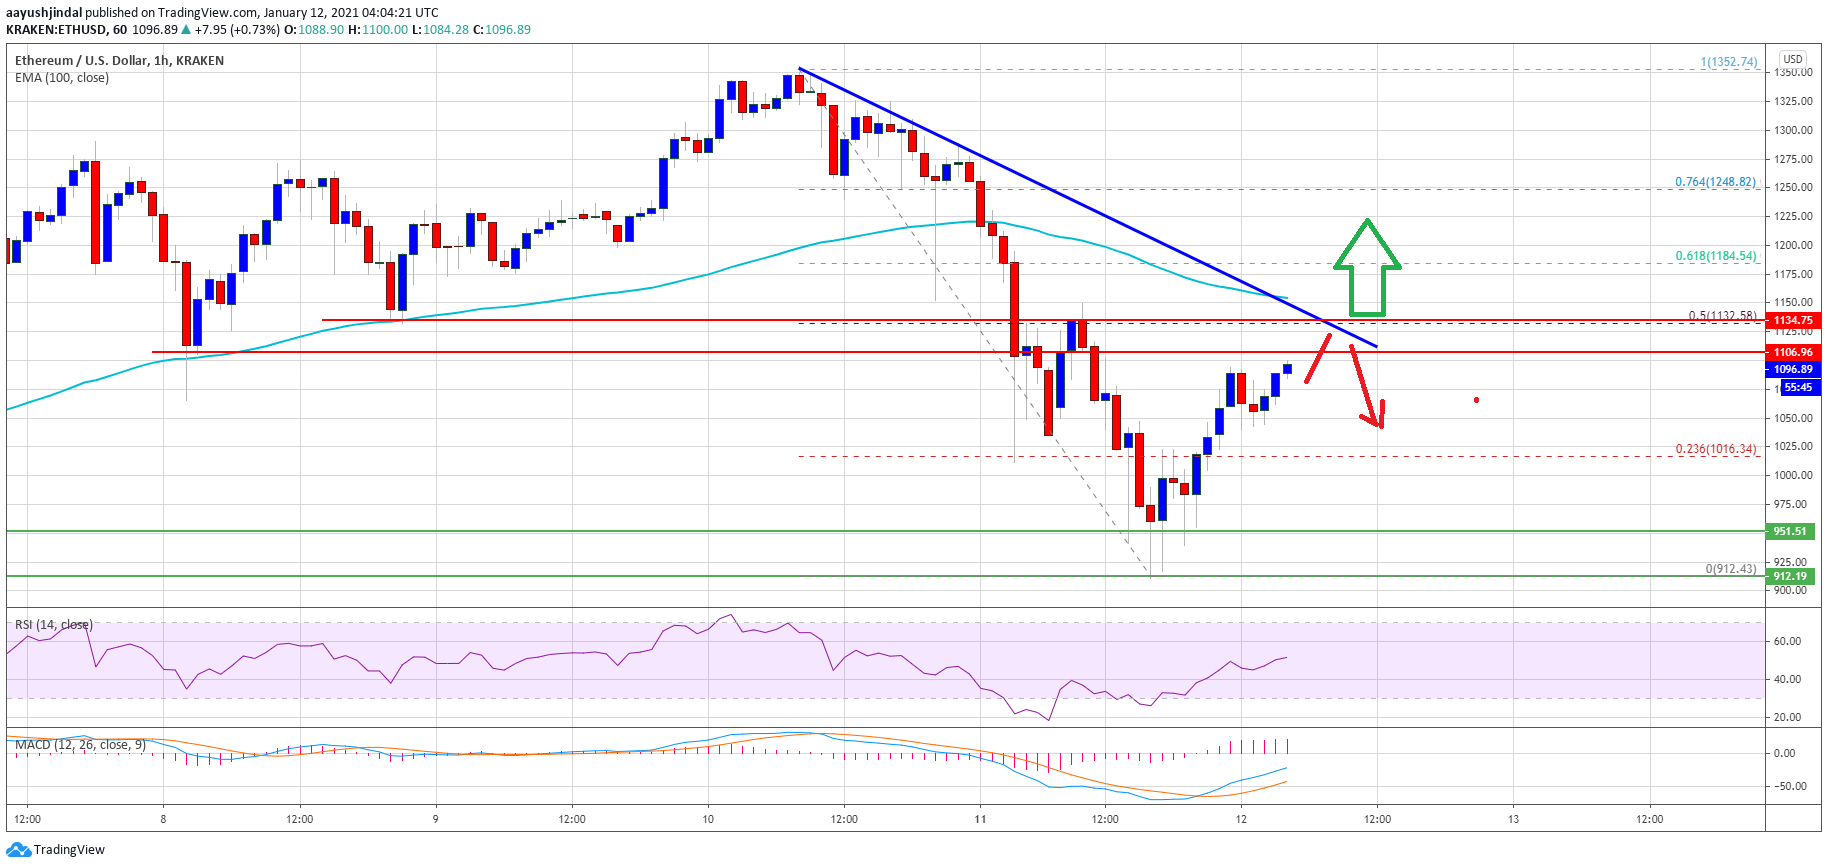
Ethereum was down nearly 30% testing the $ 900 support zone against the US dollar. ETH price is currently rising but is facing strong resistance near $ 1,130.
- Ethereum saw a sharp drop well above $ 1,200 and was trading near $ 900.
- The price is bouncing back well from $ 912 but faces hurdles near $ 1,130 and the 100-hour simple moving average.
- There is a large bearish trendline on the hourly chart of ETH / USD (data feed via Kraken) with resistance near USD 1,130.
- The pair will have to settle above $ 1,130 and the 100-hour SMA to start a new rally.
The Ethereum price makes up for losses
Yesterday we saw a massive drop in Bitcoin, Ethereum, Ripple and other altcoins. ETH price was down nearly 30%, breaking many key supports near $ 1,120 and $ 1,050.
There was also a break below the USD 1,000 support level and the price traded near the USD 900 level. A swing low was formed near $ 912 before the price rose again. It appears that the bulls have defended the final swing region near the $ 900 $ -920 zone.
Ether price is up over 10% and is trading well above $ 1,000. There was a break above the 23.6% fib retracement level of the downside correction from the high of $ 1,352 to the low of $ 912.
Source: ETHUSD on TradingView.com
However, the price faces hurdles near $ 1,130 and the 100-hour simple moving average. There is also a major bearish trendline with resistance near USD 1,130 on the ETH / USD hourly chart. The trendline is close to the 50% Fib retracement level of the downward correction from USD 1,352 swing high to USD 912 swing low.
To start a new rally, the ether price must eliminate the $ 1,130 trendline resistance and the 100 hour simple moving average. The next major resistance above $ 1,130 is near the $ 1,200 level.
Fresh dips at ETH?
If Ethereum fails to hit the USD 1,130 resistance and 100-hour simple moving average, it could see another decline. Initial downside support is near the USD 1,050 level.
The first major support is near the $ 1,000 level. A downside break below the $ 1,000 level could potentially trigger another drop towards the $ 900-920 support zone in the coming sessions.
Technical indicators
Hourly MACD – – The MACD for ETH / USD is picking up pace in the bullish zone.
Hourly RSI – – The RSI for ETH / USD is back above the 50 level at a bullish angle.
Main Tier Support – $ 1,000
Main Resistance Level – $ 1,130
