Ethereum has extended its surge above the USD 1,750 and USD 1,800 resistance levels against the US dollar. ETH price is showing positive signs and is likely to revisit the USD 2,000 resistance zone.
- Ethereum is gaining bullish momentum above the $ 1,700 and $ 1,800 resistance levels.
- The price is now trading well above $ 1,800 and the 100-hour simple moving average.
- A crucial bullish trendline is forming on the hourly chart of ETH / USD (data feed via Kraken) with support near USD 1,750.
- The pair could correct lower but there is a high possibility that it will move towards the $ 2,000 zone.
Price increase in Ethereum by 5%
Ethereum stayed in a positive zone above the USD 1,650 resistance after yesterday’s uptrend, similar to Bitcoin. ETH gained bullish momentum and even broke the USD 1,700 resistance level.
As a result, the bulls took over and the price rose above the $ 1,800 level. It was trading to a new weekly high near $ 1,858 and is showing positive signs. Ether is now trading well above $ 1,800 and the 100 hour simple moving average.
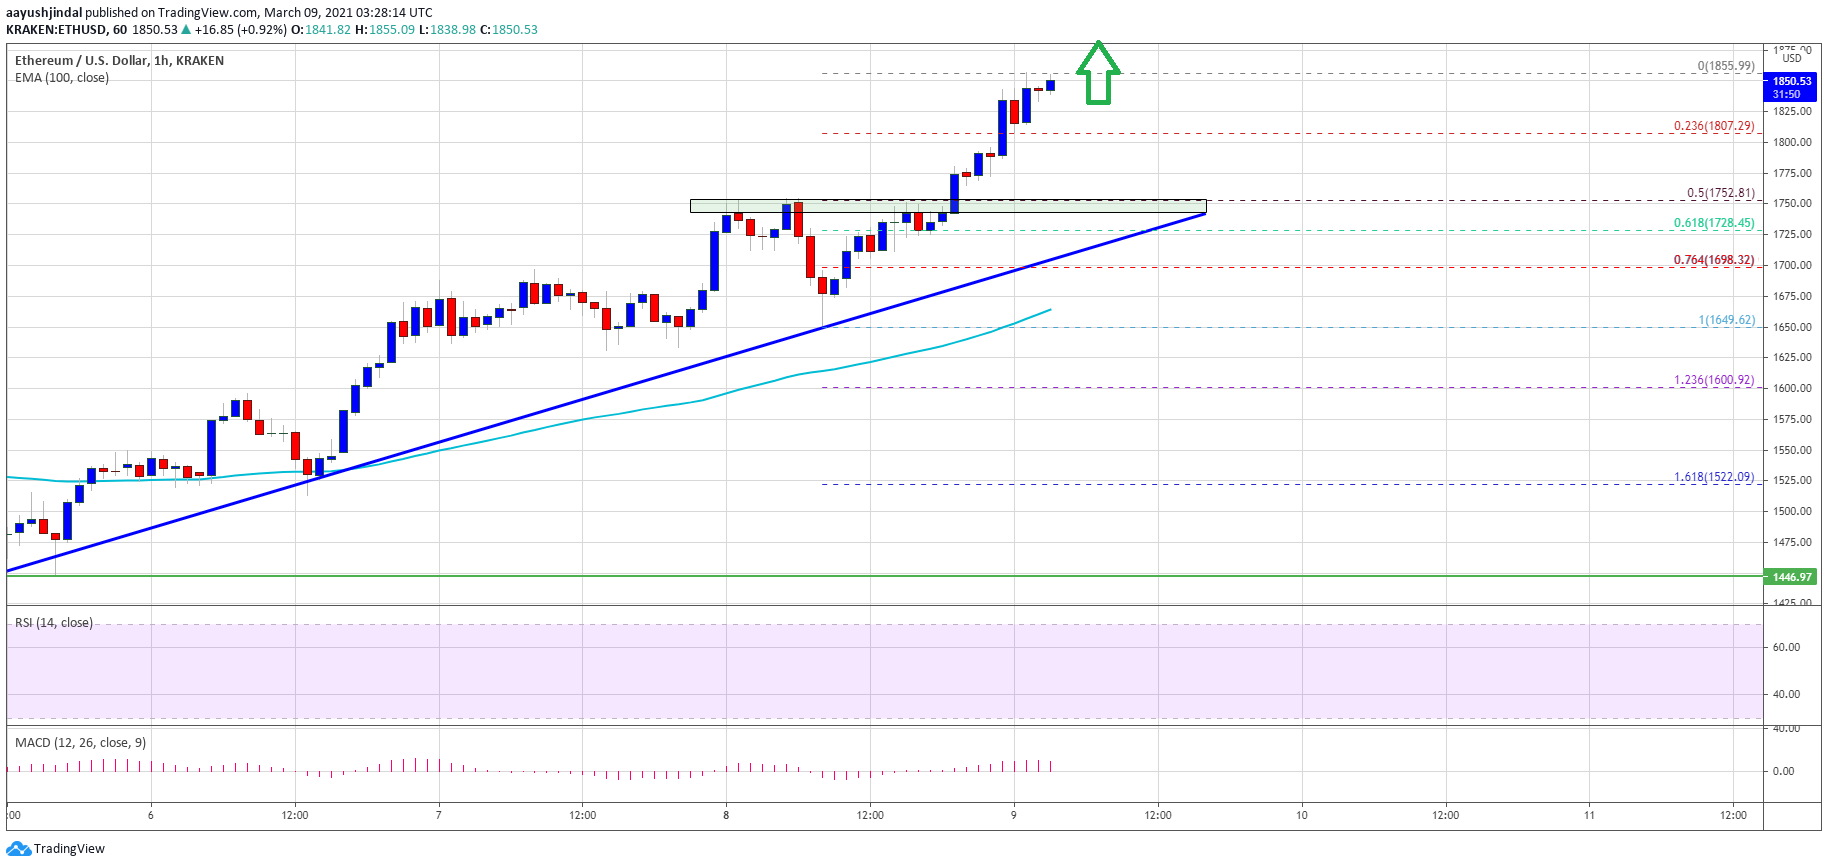
Initial support is near the USD 1,810 level. It is close to the 23.6% Fib retracement level of the recent spike from $ 1,649 to $ 1,858.
There is also a key bullish trendline forming with support near USD 1,750 on the ETH / USD hourly chart. The trendline is near the final breakout zone at $ 1,750. The 50% fib retracement level of the recent rise from the swing low of $ 1,649 to the high of $ 1,858 is also close to $ 1,750.
Source: ETHUSD on TradingView.com
On the upside, the $ 1,880 level is an immediate hurdle for the bulls. A significant break above the $ 1,880 level could open the doors to further gains above the $ 1,900 level. In the case mentioned, the price could rise above the USD 1,950 level. The next major resistance is near the $ 2,000 level.
Dips supported at ETH?
If Ethereum doesn’t stay higher than the $ 1,880 and $ 1,900 resistance levels, it could result in a downward correction. Initial downside support is near the USD 1,810 level.
The main support is now forming near the trendline and at USD 1,750. If there is a downside break below trendline support, there is a risk of falling towards the USD 1,650 support.
Technical indicators
Hourly MACD – – The MACD for ETH / USD shows positive signs in the bullish zone.
Hourly RSI – – The RSI for ETH / USD is now well above the 60 level.
Main support tier – $ 1,750
Main Resistance Level – $ 1,880
